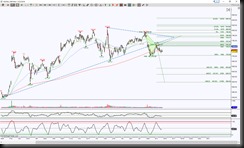
GOOGL Day chart shows price broke down a triangular formation as shown with light blue lines. Currently price is in between opposing emerging harmonic patterns, which is indicative of Decision Mode. The pull is to the downside and a hold below 717.06 increases that scenario with the initial support test target at 703.20, this will be a do or die level for the green colored emerging Bat. Below 703.20 focuses on the ABCD target 653.62.
There is a potential breach above 717.06 to test 741.37 but above there increases the probability of completing the Bat at 780.95.
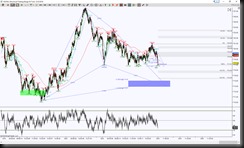
For the intraday perspective, I’m using an STRange 50 bar. This chart shows price is at a small Bullish Butterfly PRZ which is an opportunity for buyers to step in for a Retrace Mode attempt which would correlate with the Day chart bounce into resistance scenario. The ideal minimum target is the gray GRZ (Golden Ratio Zone aka the area between the 38.2% and 61.8% fibs) at 718.50 and the dreamed of target is 720.92 with scaling points at the gray levels with emphasis at 719.43 (top of GRZ).
However, this small Butterfly could merely be a means to an end, note the larger emerging Gartley having a PRZ target at 714.02 to 712.91. This small Butterfly has helped price to retest the B point of the larger Gartley. I’m always in awe how harmonics not only call price to them, but also engage into smaller patterns to help the larger ones play out.
This chart, like the Day chart, shows a downside pull, but at a juncture for a stall or bounce into resistance.
Trading involves substantial risk and is not suitable for all investors. Past performance is not indicative of future results.


