
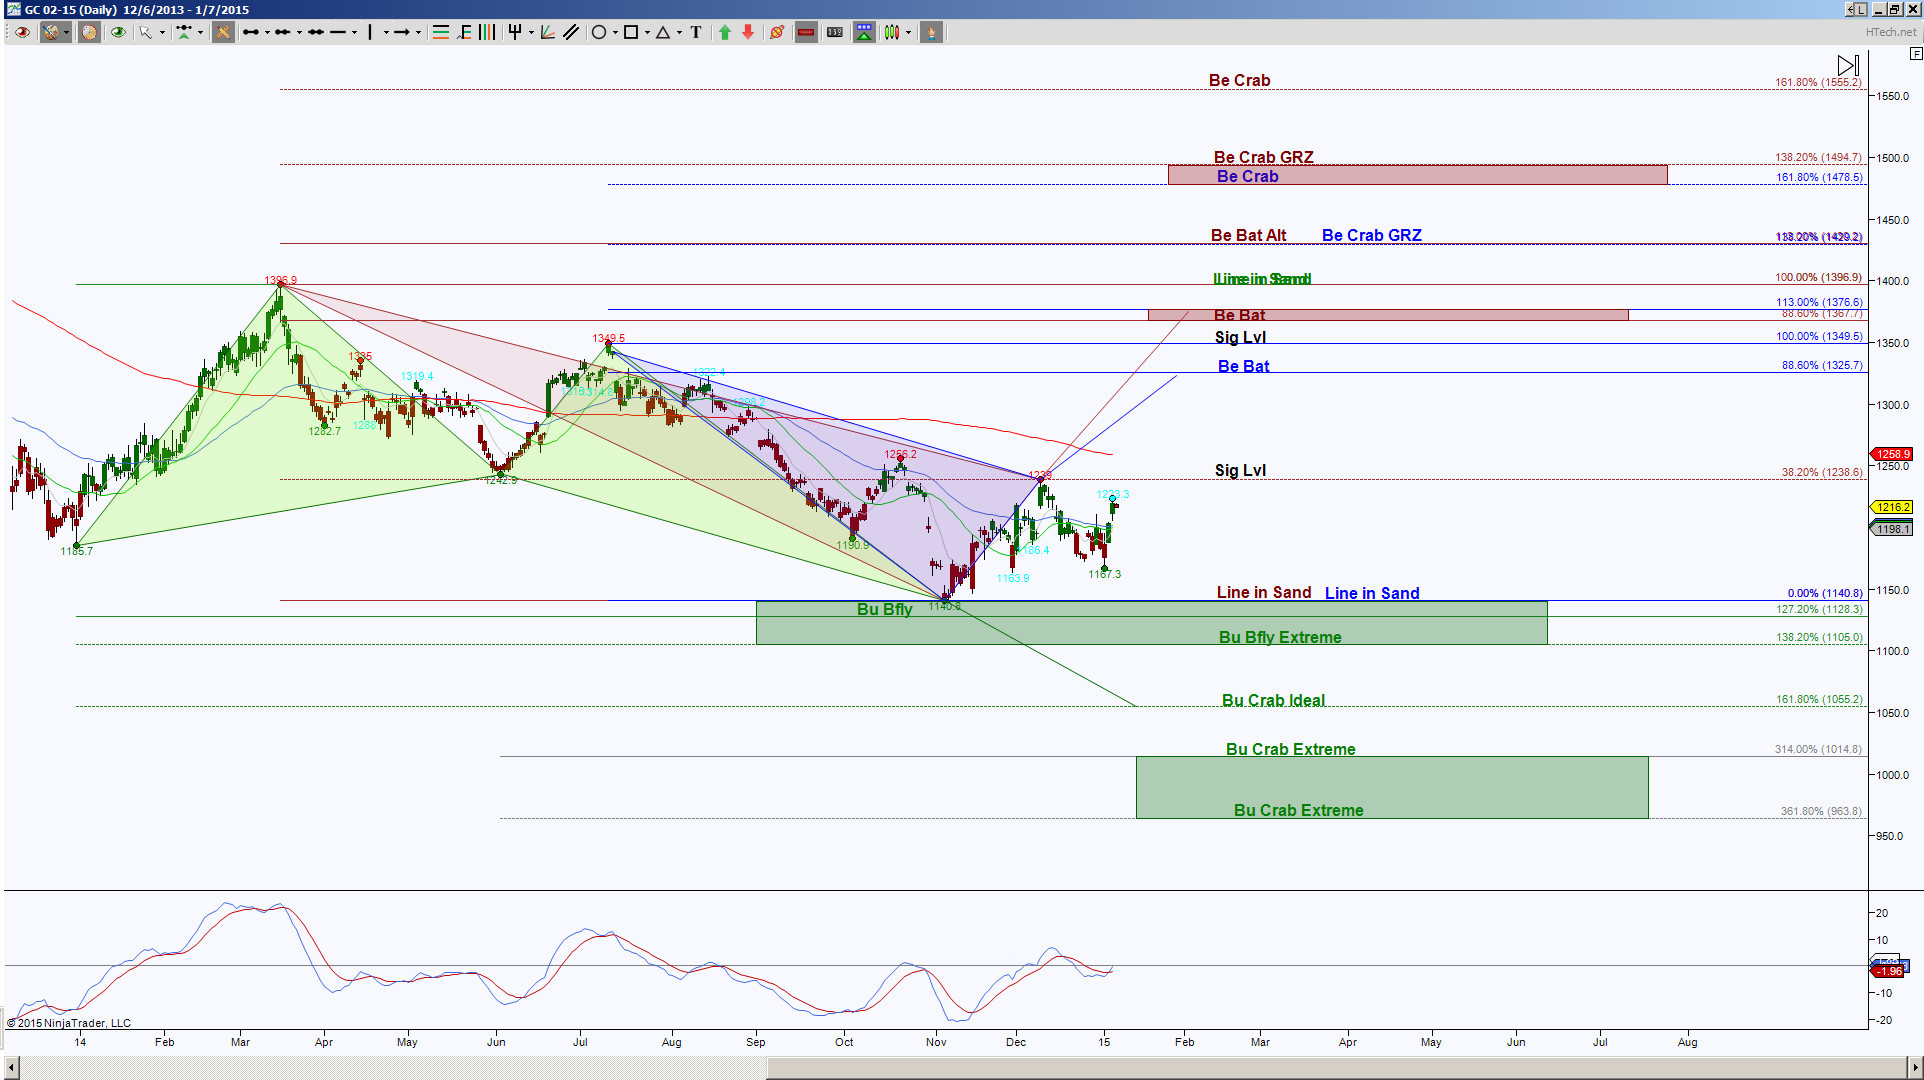
This day chart of GCG15 (February contract for Gold Futures) shows price has completed a bullish harmonic pattern, called a Butterfly, as noted with corresponding green colored fibs, triangles and notations. The ideal minimum retracement target for this pattern is 1238.6, which price has tested and the ideal retracement target is 1936.9. The 1936.9 is the dream target for this Butterfly but if that’s the case, it will help price have an upside bias. There are of course what I call obstacles, these are levels in route of that ideal target which are potential rejection points and offer the bears an opportunity to step in to push price lower.
The blue and brown colored harmonic scenarios have completion targets at 1325.7 and then a double completion at 1367.7 to 1376.6 zone. When there’s two different rotations that meet into one region, that behaves as more of a probability of being both a magnet as well as a rejection area, so these are important scaling points along the way to that ideal target of 1396.9. There is of course a possibility that price will go higher and take out the 1396.9 target. Well the blue and brown colored patterns also offer upside continuation targets at confluence targets of 1429.2 and 1478.5 to 1494.7 zone in route to the prime target of 1555.2. Alot of targets? Yes, and it doesn’t matter to me if price gets there or not, but if it does I have something to target as well as a place to prepare to exit.
In just this span on the chart, price has had downside bias, so if it cannot get back above 1238.6, the implication is a retest of 1140.8. Below this level will wipe out both the blue and brown colored harmonic pattern scenarios and a hold below 1140.8 has the ideal target of 1055.2 with scaling point 1105, as well as continuation targets of 1014.8 and 963.8.
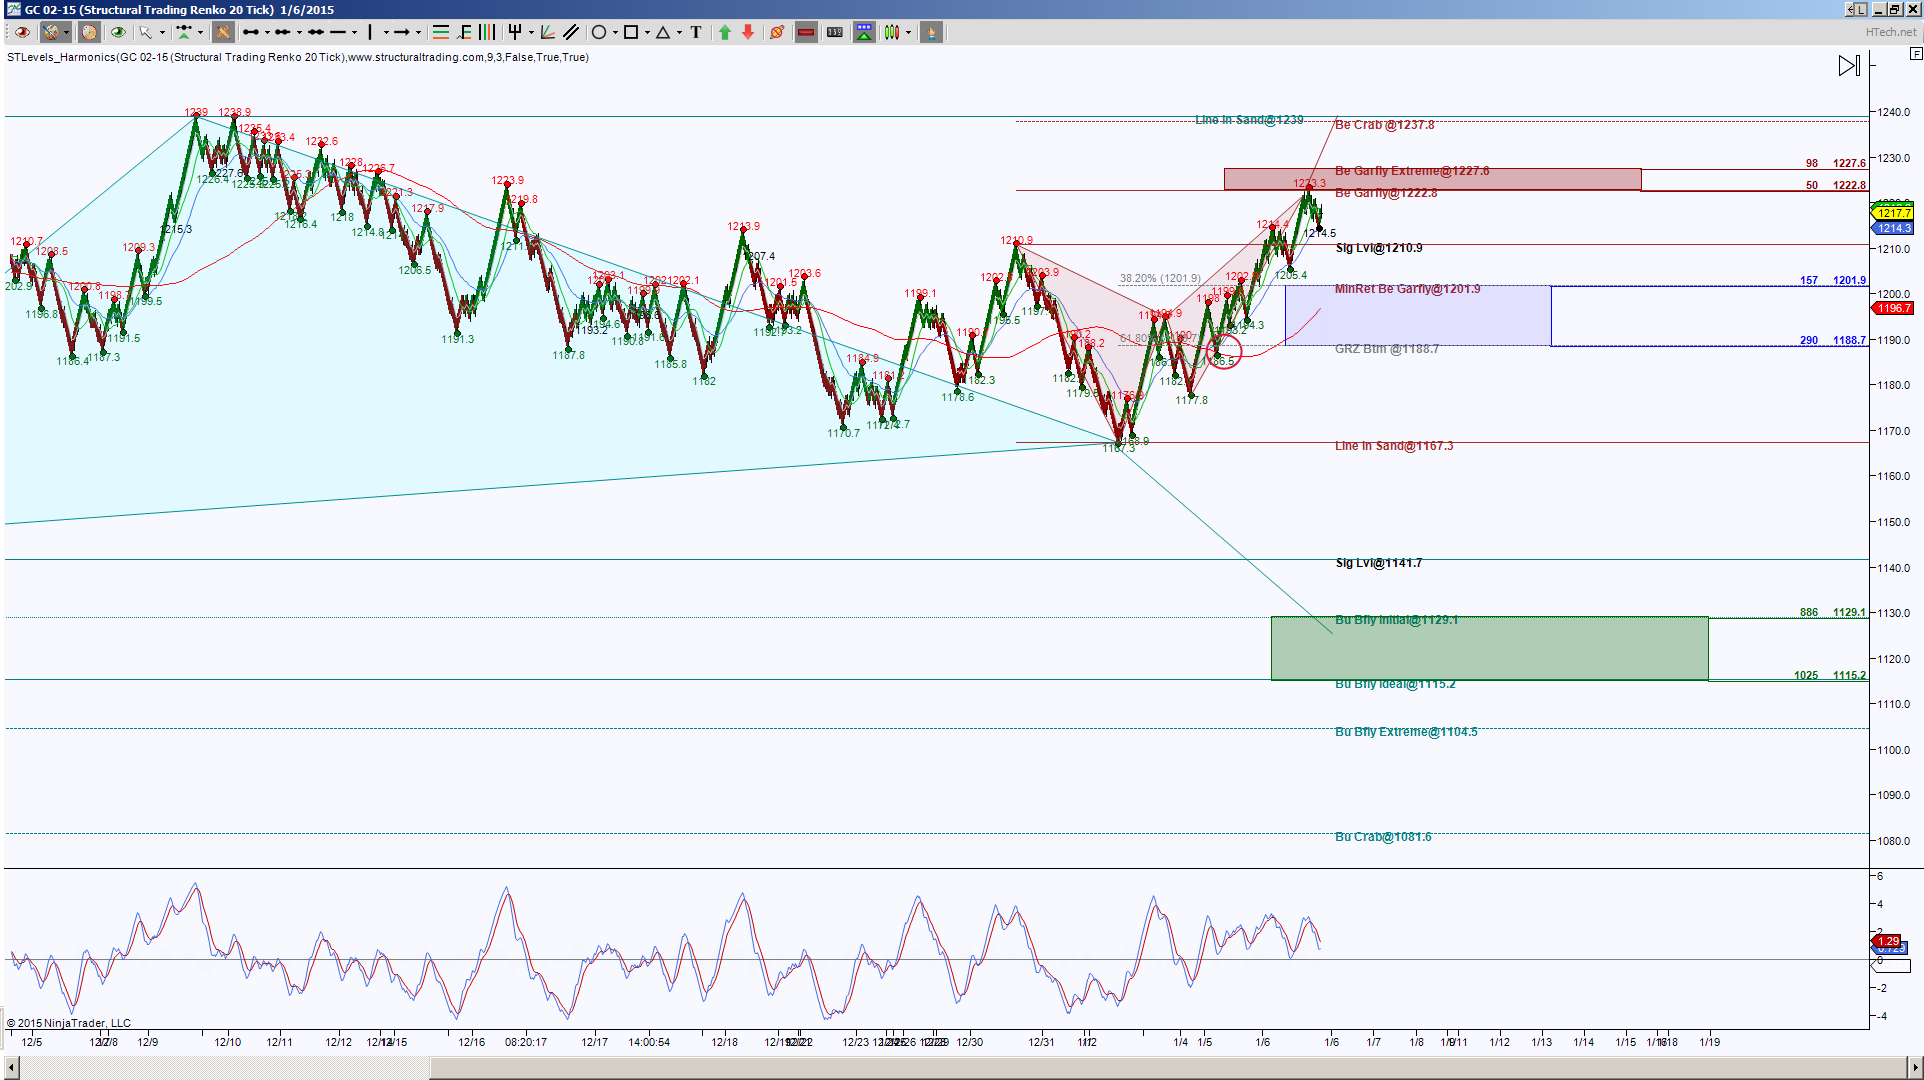
Now looking at an intraday perspective, in this case, I’m using an STRenko 20 bar, shows that price has pulled back after the initial test of a bearish pattern’s completion point, colored brown and called a Garfly. This may not be a harmonic pattern you’ve heard of but I’ve seen this pattern repeat itself so much I personally like to respect it’s rotation. So, how much this pattern can retrace will be key. Currently price has come back enough to validate a bullish cross and 1214.3 is the extreme of this validation, below there has 1210.9 target. The ideal minimum retracement target is 1201.9 and the ideal target is 1167.3. If there’s a level noted on the chart, I deem that a scaling point or potential rejection area.
I think it’s interesting that if the cyan colored Butterfly completes, this will help the day chart level of 1140.8 be breached and remember that’s the level that can eliminate those two day chart patterns. On the other scope of the intraday perspective, above the Garfly PRZ at 1227.6, the ideal target is 1237.8, this will help price retest that Significant Level on the Day chart that is a key element for increasing the probability of upside targets being tested.
Trading futures involves substantial risk & is not suitable for all investors. Past performance not indicative of future results.