
GC_F Day chart shows price completed a bearish harmonic pattern, called a Shark at 1386.6, then flipped a coin while in a triangular formation and Friday’s close below the triangle says “it’s tails”. A valid breakdown of the triangle, aka should price bounce up to 1346 area and hold below there, has an ideal minimum retrace target at 1261 and ideal targets at 1222.3 or 1058.2 which would be extreme.
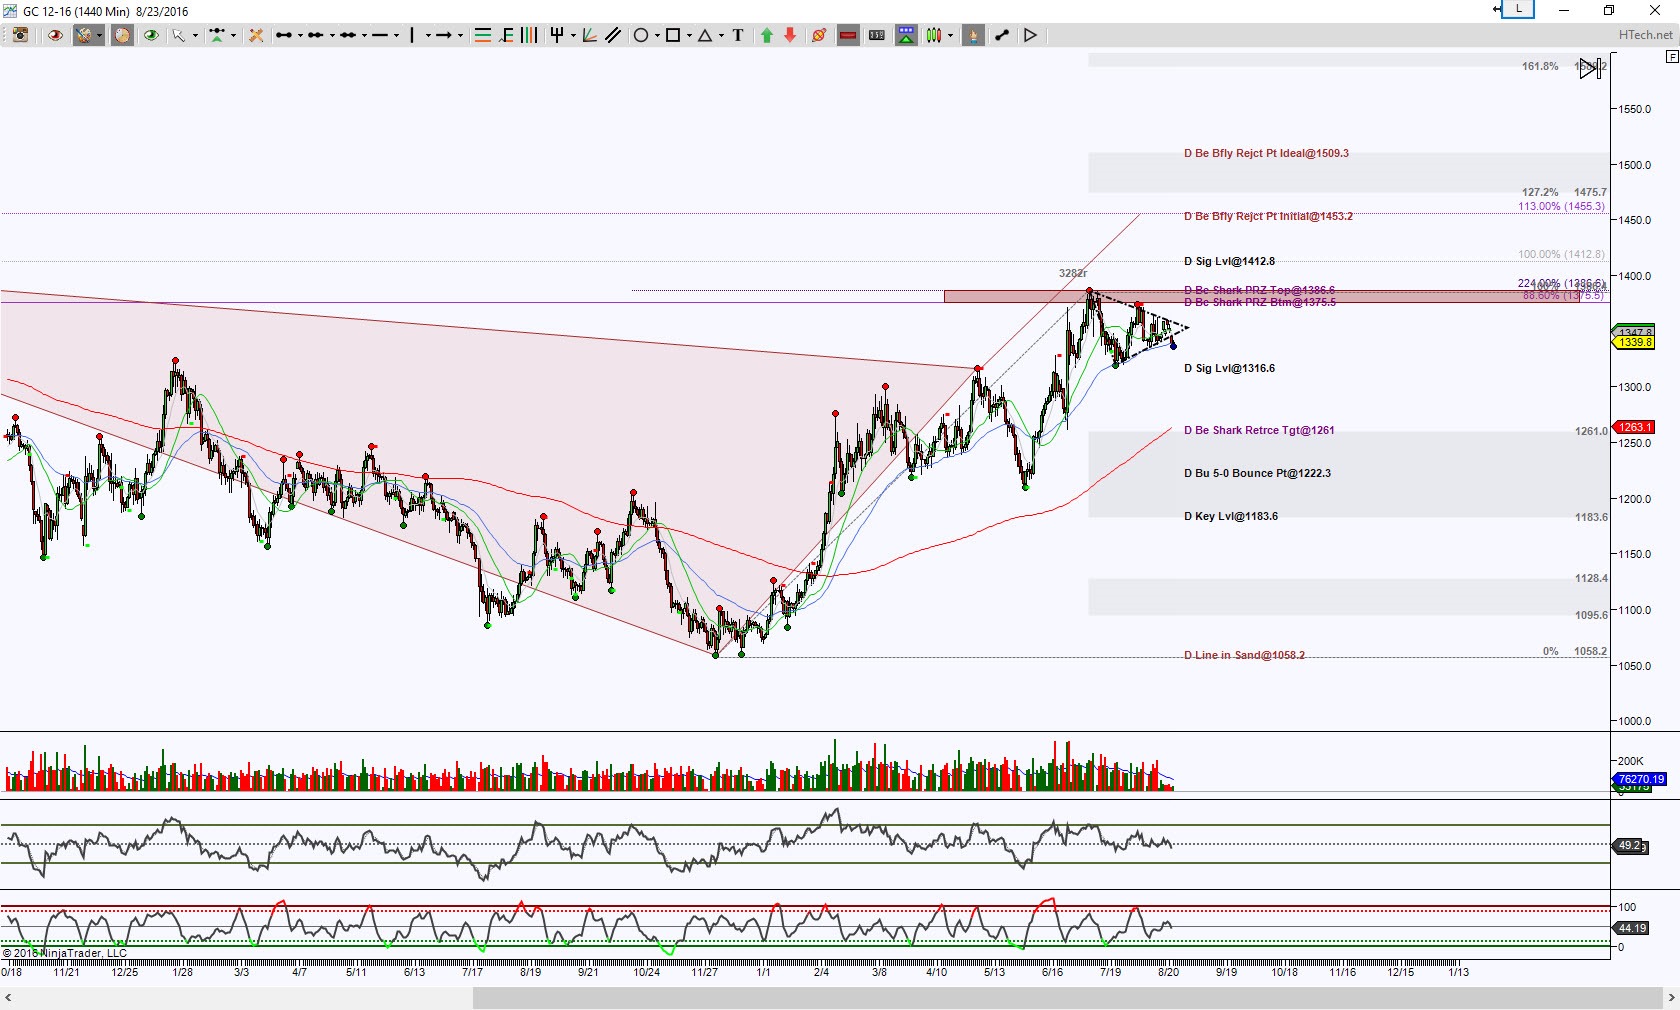
GC_F Day chart
Now for an intraday perspective, I’m looking at an STRenko 30 bar chart which shows that there is some convergence at 1335.3 for support test and if price can hold back above 1340.5, the probability is to test 1344.8 to 1348.2 for resistance, this would correlate with that Day chart triangle breakdown point.
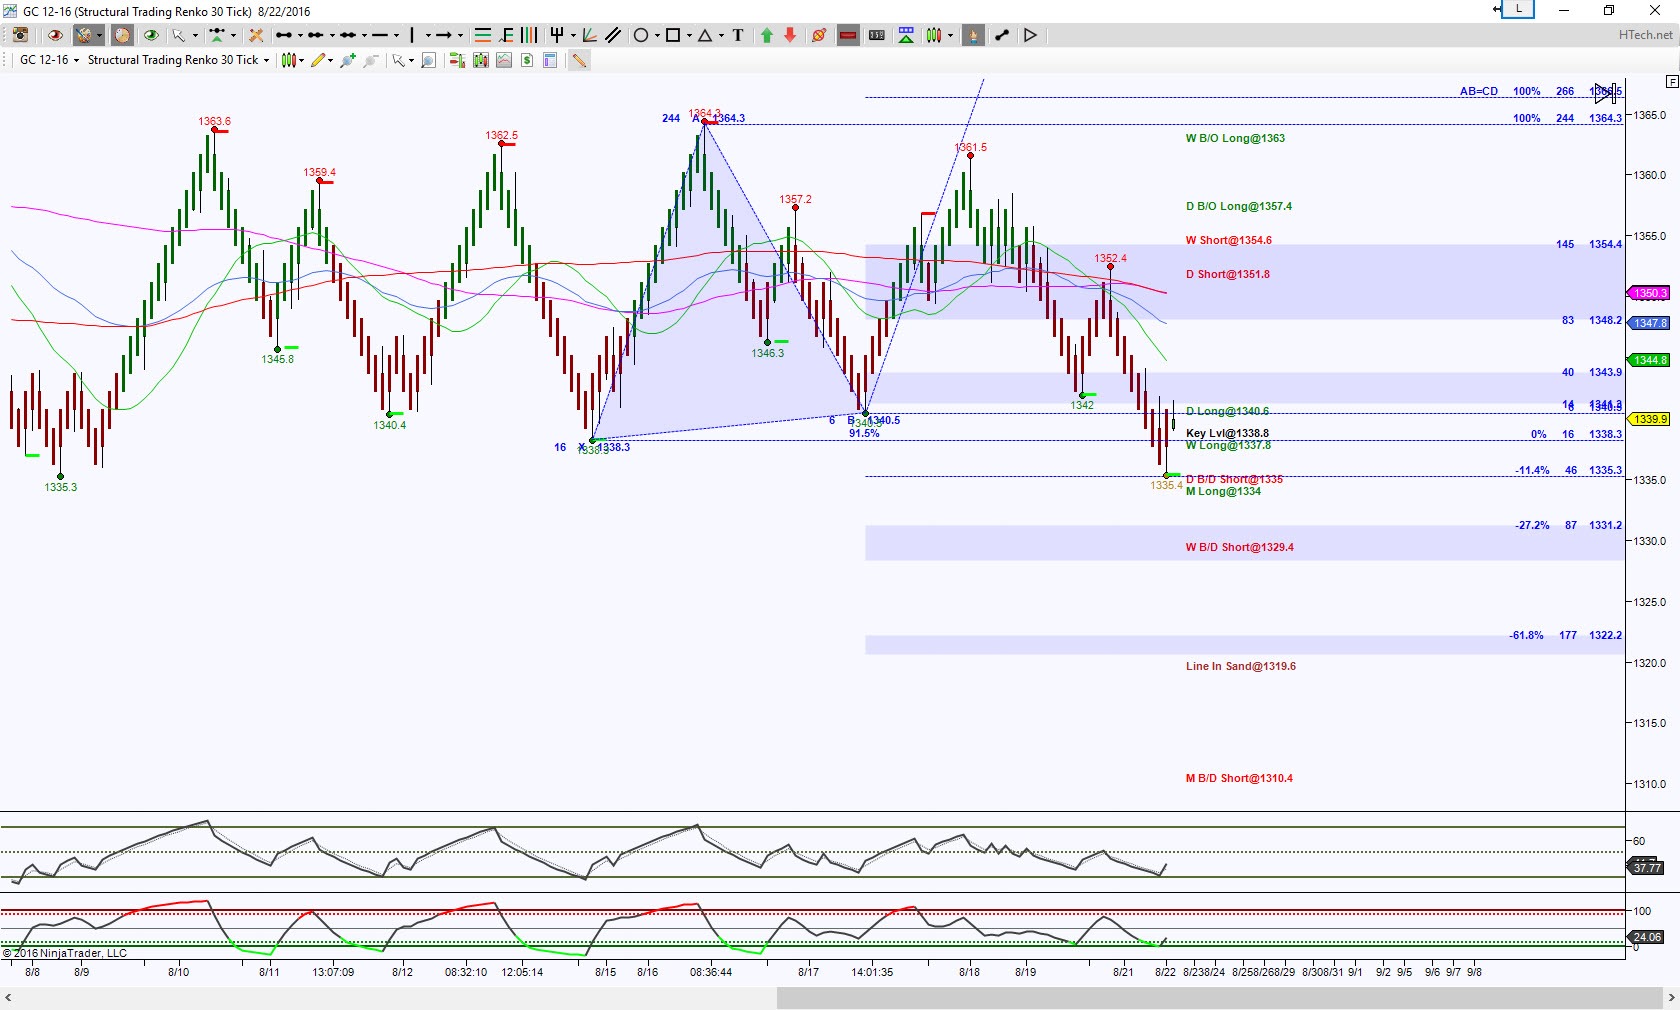
GC_F STR30
Harmonically speaking there’s a calling to 1322.2 region, and that scenario increases with a hold below 1335.3, then that would be another coin flip area. Harmonic patterns offer targets as well as probable rejection points, so when they complete, they are places to take some scaling profits or prepare for a potential rejection.
Trading involves substantial risk and is not suitable for all investors. Past performance is not indicative of future results.