
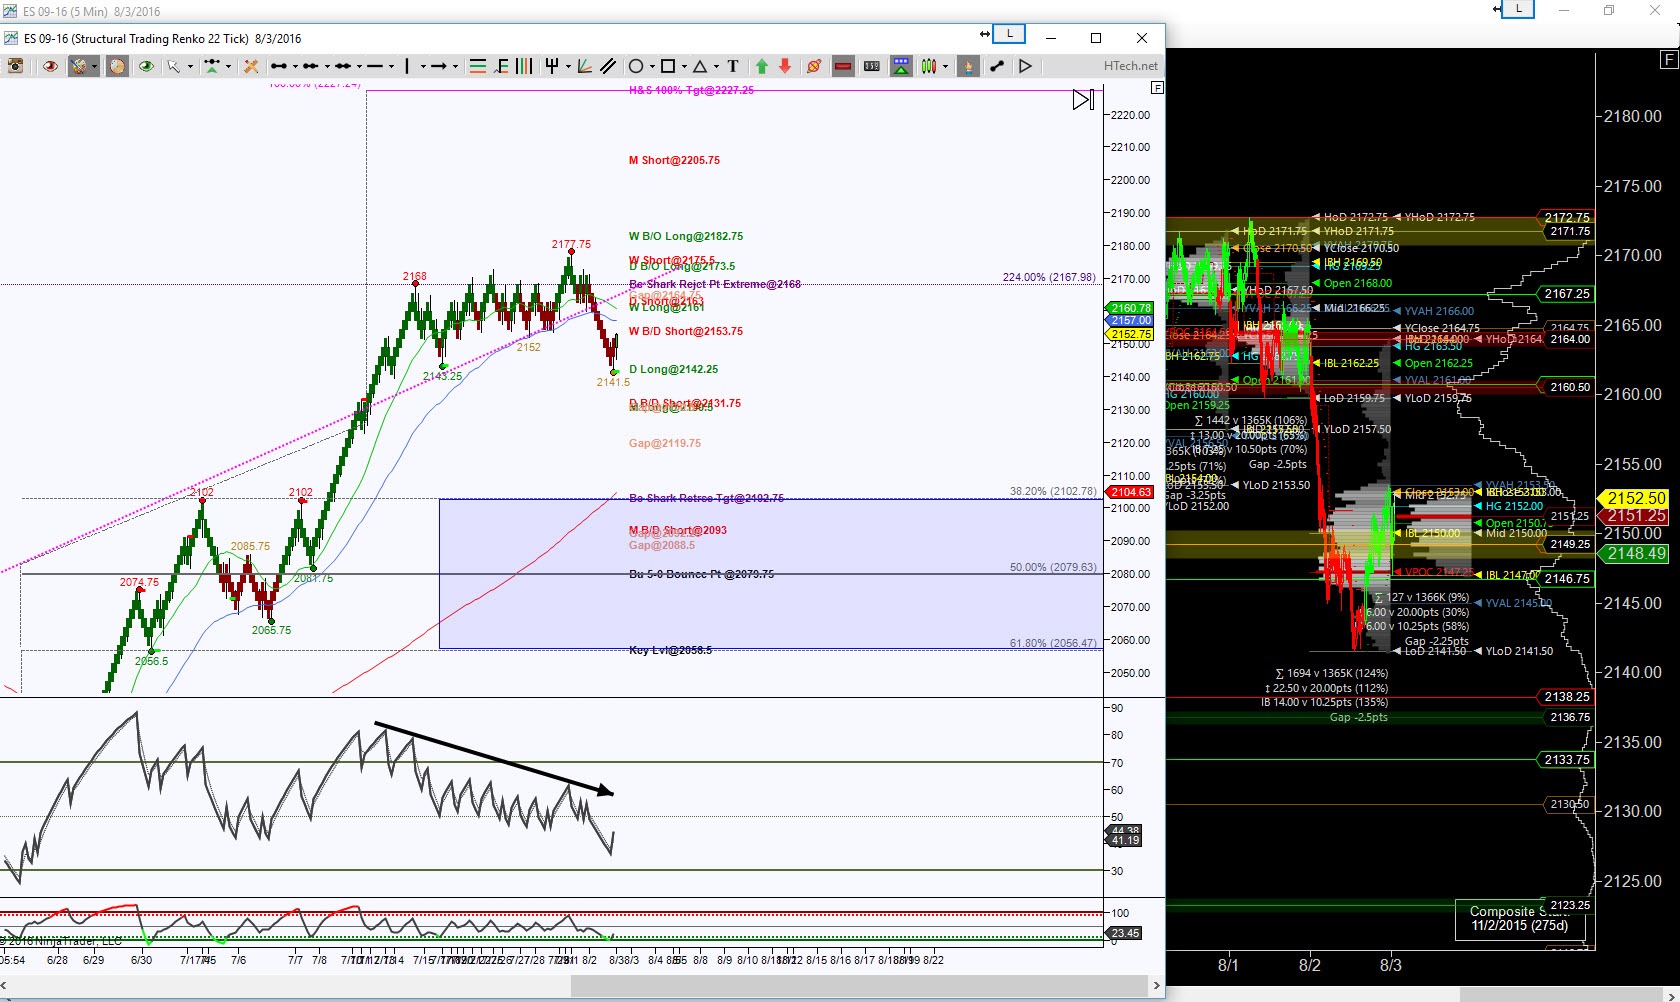
ES_F completed a harmonic pattern called Bearish shark at 2168 and currently is attempting to go into retrace mode, having its ideal minimum target at 2102.75 and ideal target 2079.75. There are some scaling points along the way as noted on the intraday chart with emphasis at 2131.75.
For an intraday chart I’m using an STRenko 22 bar chart. Unlike NQ_F which did hit it’s Inverse Head & Shoulder target, ES has thus far failed to do so, but rather has fallen back below its Inverse H&S neckline. This chart shows there’s a potential bounce into 2153.75 or the zone between 2161 to 2168 for very important resistance tests. Important because if price holds below there, the intraday bias is to downside and increases the probability of testing 2102.75 or 2079.75 targets.
Should price be able to hold back above 2168, there will need to be some conviction since there is now a rollover effect as well as a major magnet at 2160.50 as shown on the Volume Profile chart and this has chop scenario. So if there is some conviction to surge through 2168, the probability of testing the H&S target of 2227.25 will increase above 2182.75.
Trading involves substantial risk and is not suitable for all investors. Past performance is not indicative of future results.