
ES_F Day chart shows price is inside a consolidation type formation as well as in between opposing emerging patterns which is also indicative of indecision, thus each side tapping their foot awaiting for price to take out important levels.
Currently Day chart contraction is in between a Line In Sand level 2184.75, this being a separator of patterns, and a blue trendline. So above 2184.75 will invalidate the green emerging Butterfly pattern and focus on completing the green ABCD at initially 2238.50.
There is some expansion which implies a stall or pullback into support, if the latter occurs and price falls back below the trendline the initial pullback target is around 2130 region but 2104.5 will be in sights if that 2130 cannot hold. The bias is attempting to shift from neutral to up but needs some conviction after the balancing period and a hold above 2184.75.
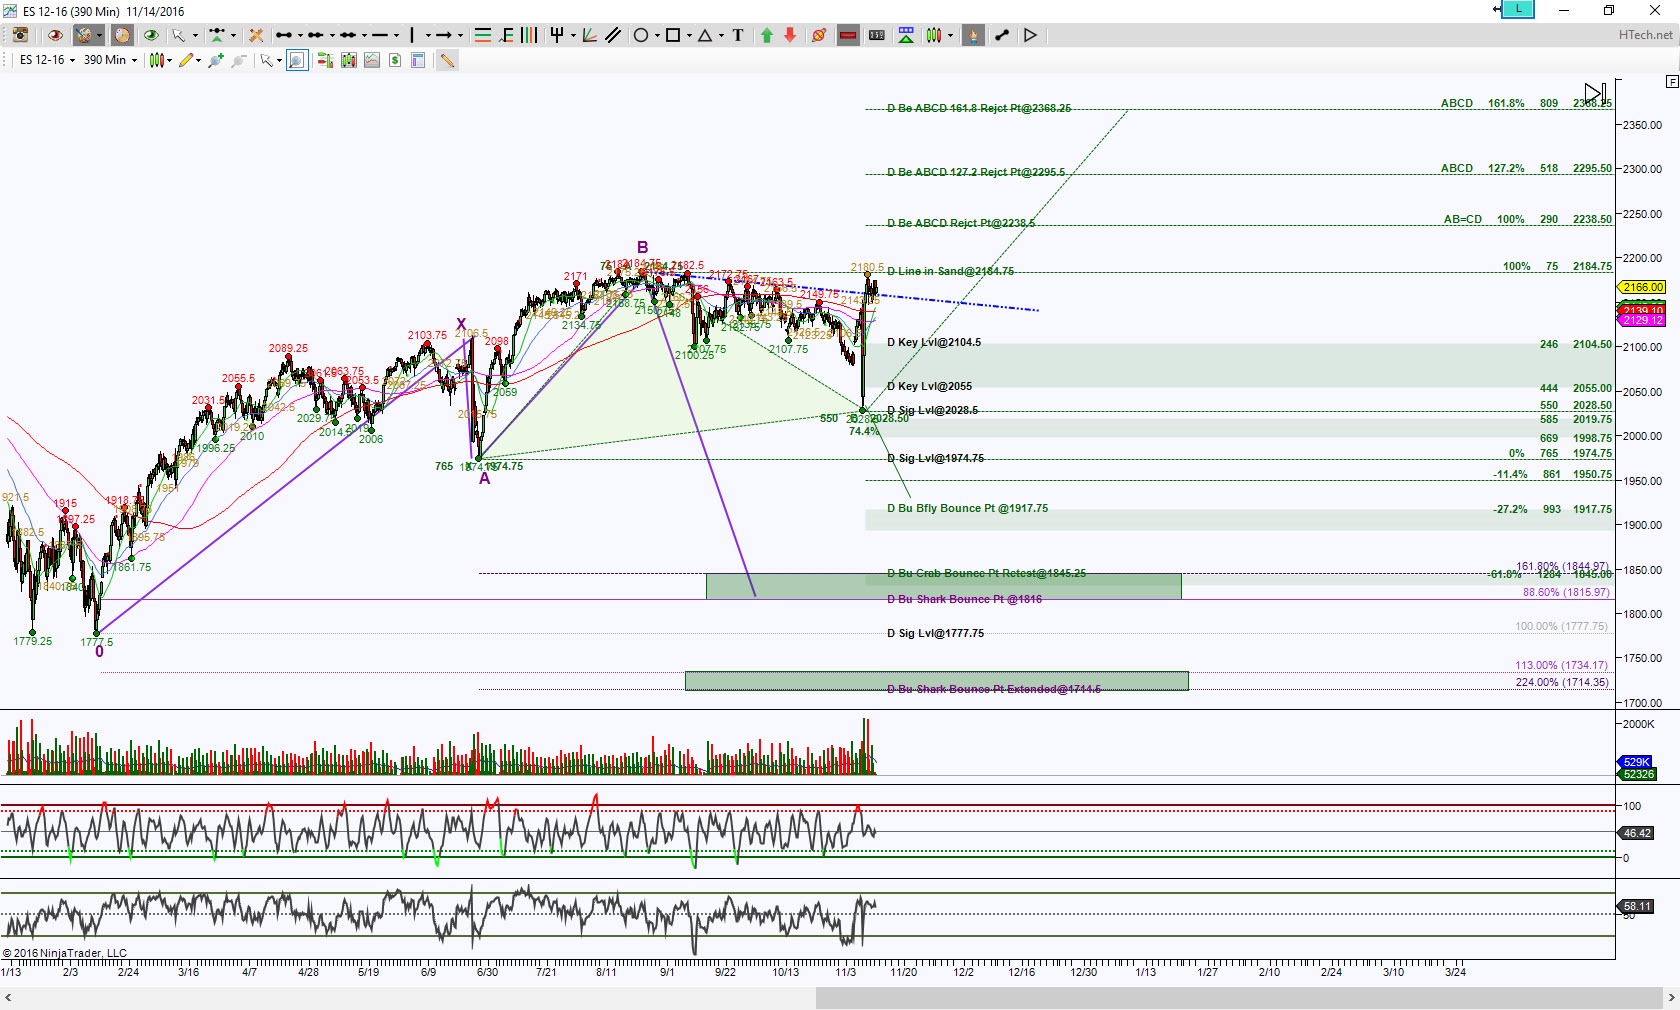
ES_F Day chart
For an intraday chart, I’m using an STRange 12 bar, this chart also shows consolidation action as price is in between smaller opposing patterns scenario. This view shows a zoomed in view of initial levels to take out to increase the probability of taking out the Day chart levels.
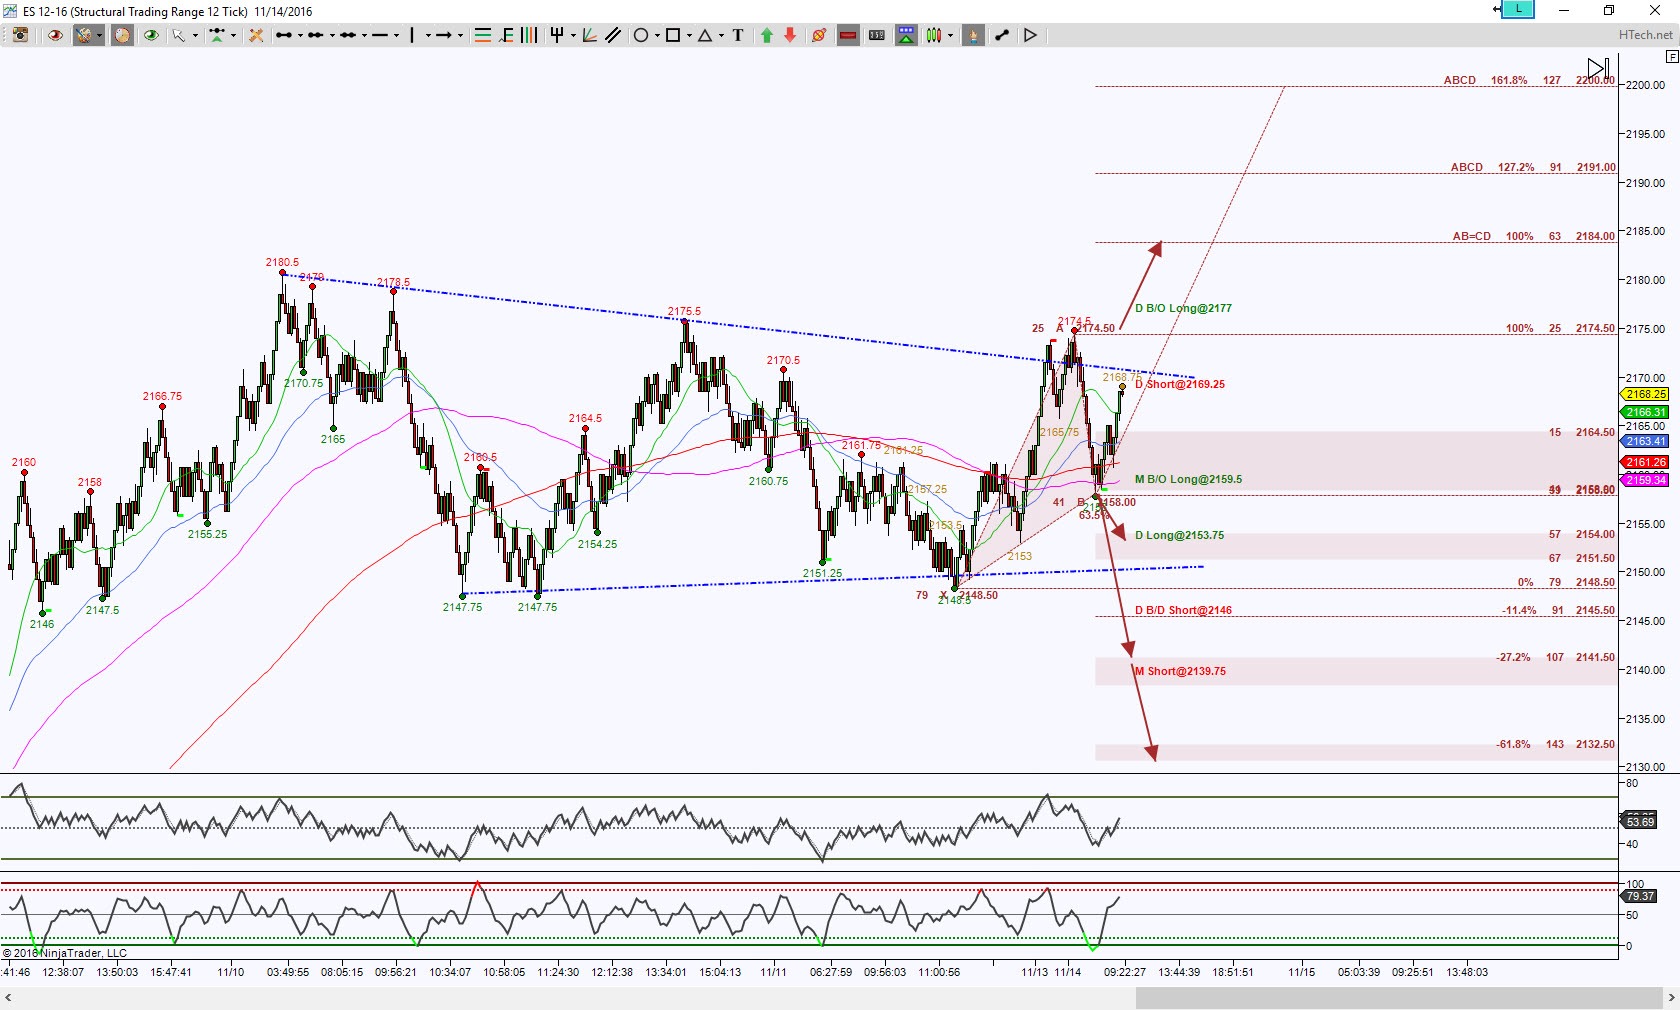
ES_F 50 STRange
Price is inside a wedge type formation, so the blue trendline resistance line which correlates with a Swordling at 2169.25, above there doesn’t have far to go to test a Significant Level 2174.5, it’ll be at this region that conviction to an upside move is ideal to increase the probability of completing the brown ABCD at 2184 for starters.
However, a hold inside the blue trendline parameters implies a retest of the lower region of this consolidation. Harmonically speaking, ideal targets are 2154, 2141.5 and 2132.5. Each of these levels behave as magnets once price can hold below first 2164.5 then more important below 2158, they are also probable rejection levels so they represent profit taking regions if short or an area to watch for price action to confirm a bounce.
Trading involves substantial risk and is not suitable for all investors. Past performance is not indicative of future results.