
DX_F Day chart shows price completed a harmonic pattern called a Bullish Butterfly and is currently in retrace mode aka seeking retrace fibs to the upside as shown with the gray zone levels. The ideal minimum retracement target is 95.255 and the ideal target is 100.715, this of course is dreamed of retracement in the world of harmonics.
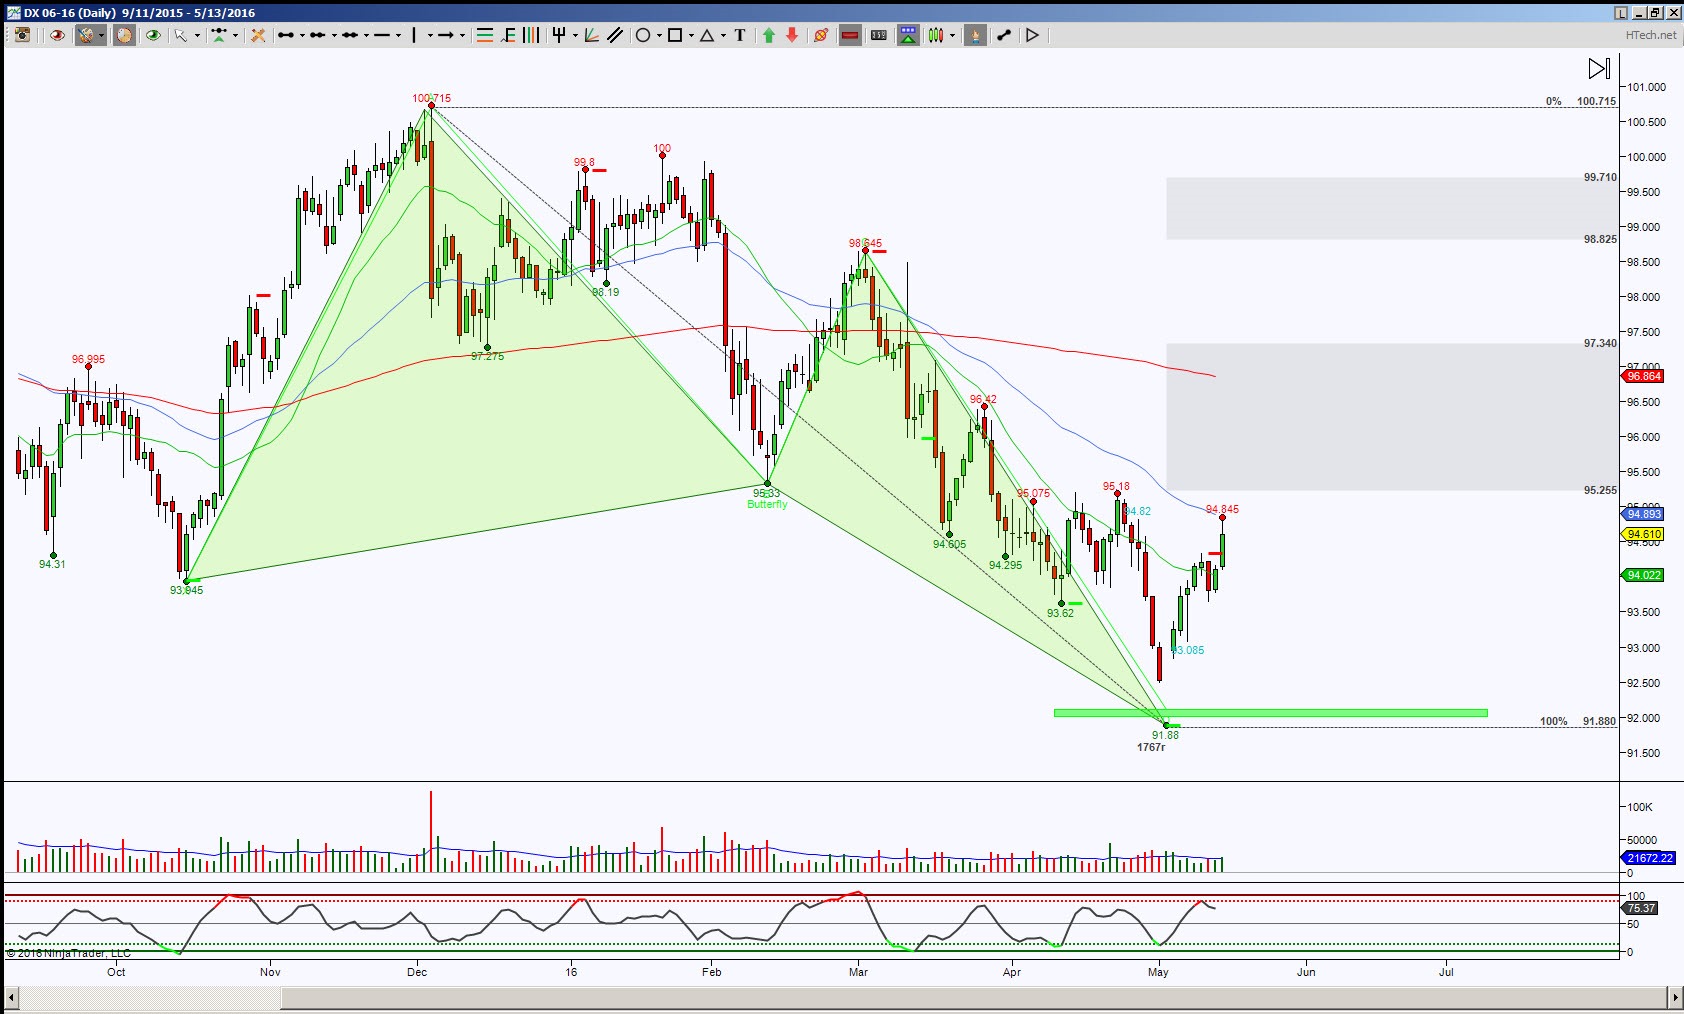
The probability of reaching the ideal retrace target increases in its probability with a hold above 95.255 then more important above 97.340. But a rejection of 95.255 or failure to get there implies a retest of 91.88 region or there is an extended lower target of 89.761.
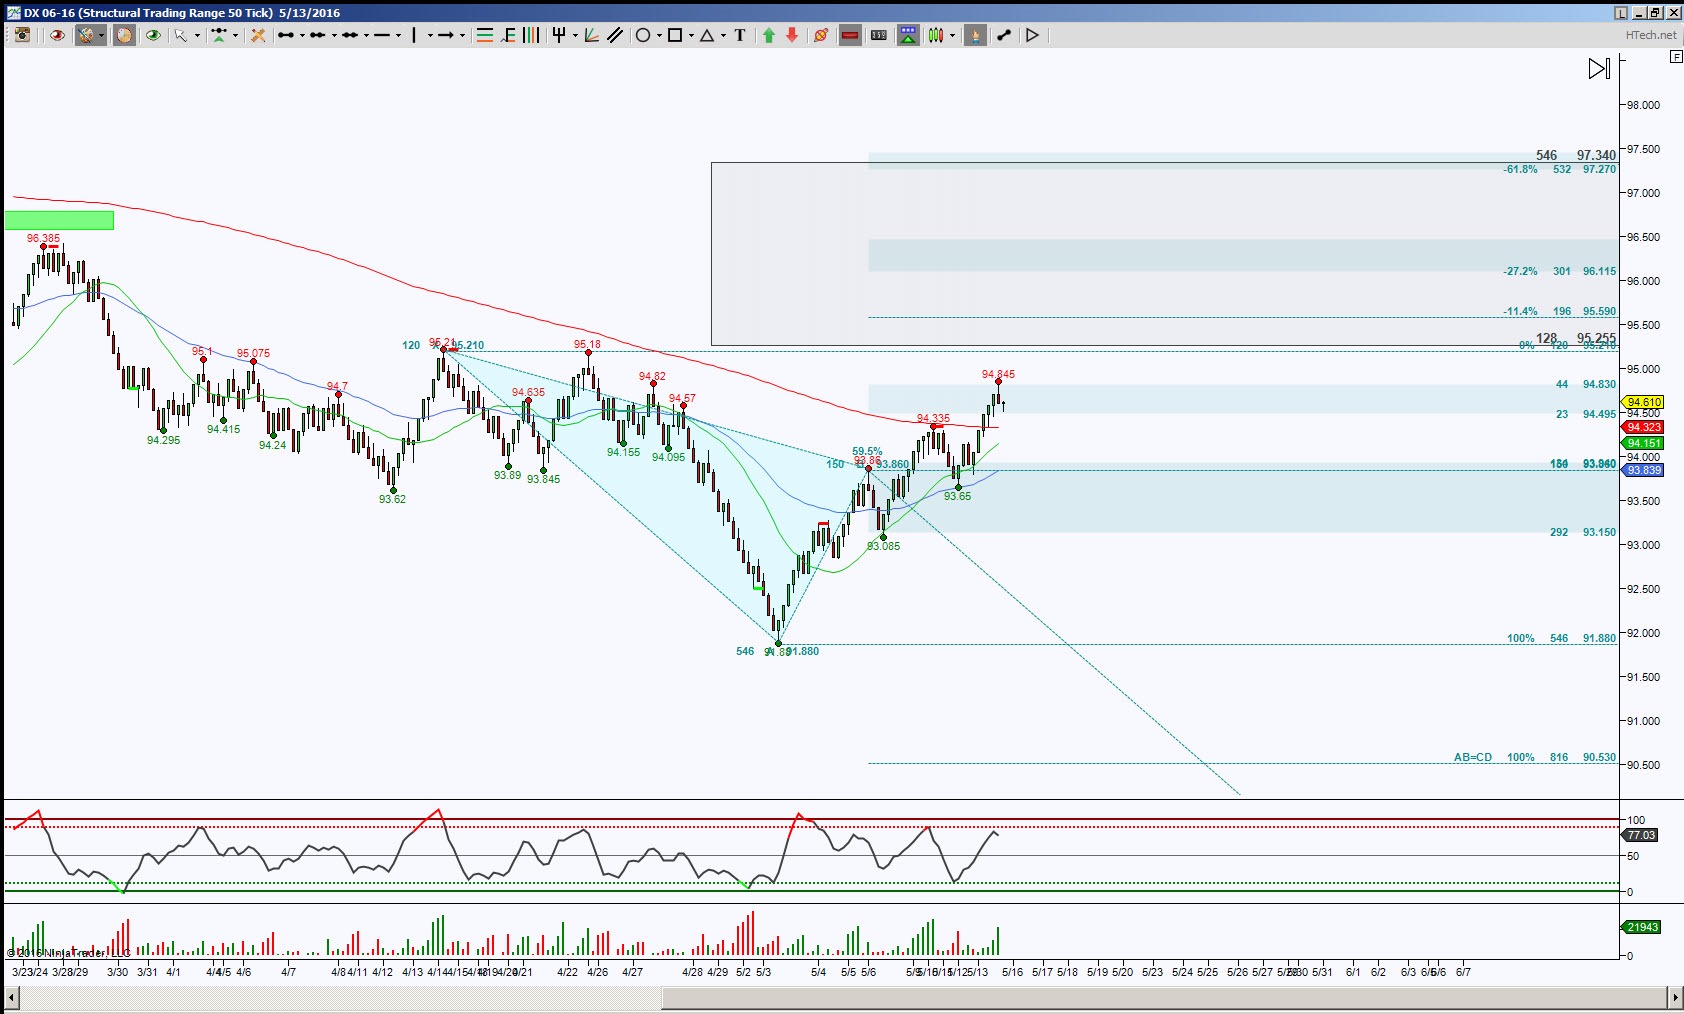
For an intraday perspective, I’m using an STRange 50 bar chart, which shows the initial gray zone as stipulated on the Day chart. This chart has an emerging harmonic pattern which has three distinct targets, the first being where price is currently stalling in between 94.830 to 94.495. So watch for a break and h0ld beyond these levels first, a hold below there has a pull back target of 93.86 and this will be a very important support test because as long as price can hold above there implies the cyan pattern extended targets are still in play. The second harmonic PRZ (Potential Reversal Zone aka the completion zone for a harmonic pattern) is 96.115, note this is approximately the half way mark of that Day chart gray zone. And the third cyan PRZ target is 97.270, note this will help test the Day chart gray zone level 97.34.
Trading involves substantial risk and is not suitable for all investors. Past performance is not indicative of future results.