
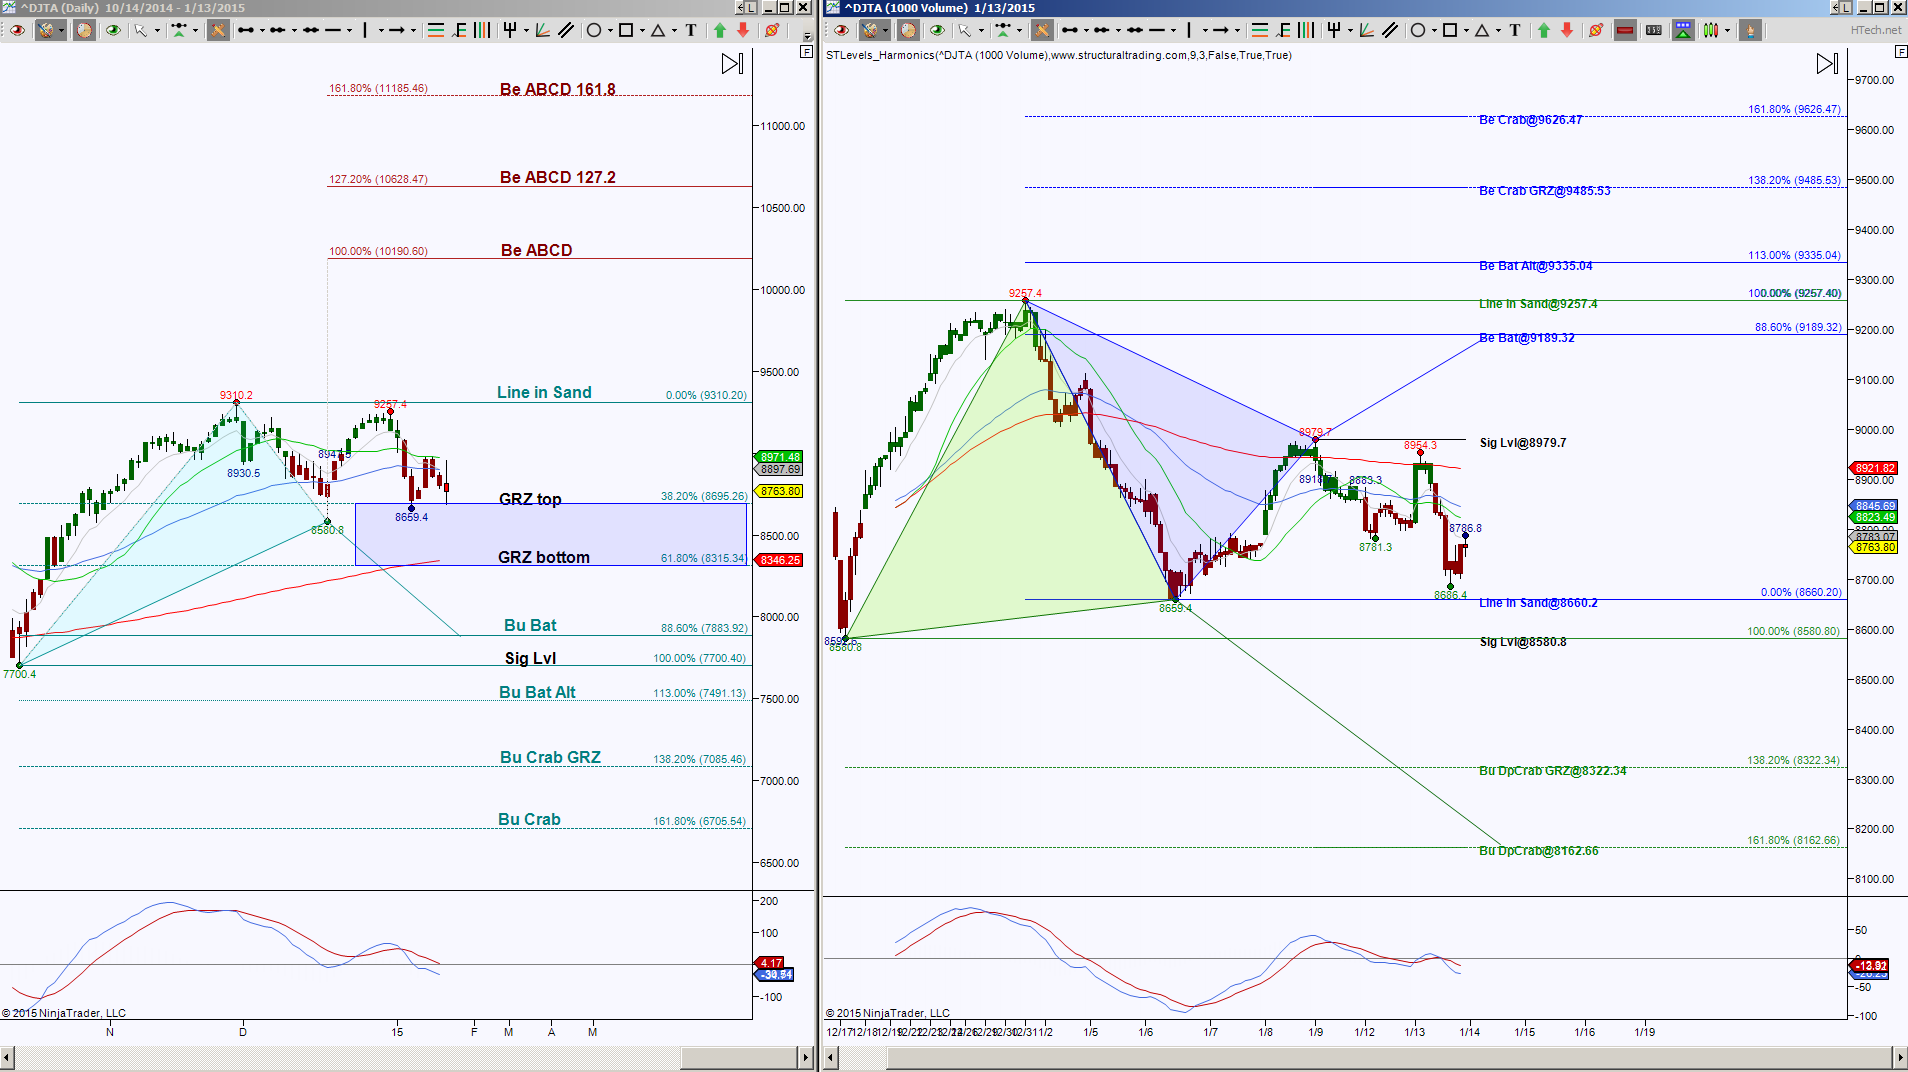
The Dow Jones Transportation Average has signs of weakness but has a deciding point at the 8695.26 level. The left side of the above charts, is the Day chart showing that a zone, I call GRZ aka Golden Ratio Zone which represents the Fibonacci ratios between 38.2% and 61.8%, is being tested as support. The longer price holds above here the higher the probability of being range bound. That range top is 9310.20. So a break and hold beyond either 9310.2 or 8695.26 offers directional bias target probabilities.
Above 9310.20 has symmetrical targets at 10190.6, 10628.47 and 11185.46. Below 8695.26 has the initial harmonic pattern target at 7883.92 and scaling point at 8315.34. Downside continuation ideal target is 6705.54 with scaling points at 7700.40, 7491.13 and 7085.46. Keep in mind that I consider scaling points as potential rejection levels which do have the capability to prevent the extreme targets from hitting in the near future.
That’s the larger view of DJT, the right side of the charts is an intraday view, in this case I’m looking at a 1000 volume chart. Now this smaller perspective has more of a downside bias than the Day chart, however the 8660.20 is a level to reckon with regarding support. As long as price holds above this level, the upside target of 9189.32 is a possibility, but a hold below 8660.20 invalidates that harmonic scenario and focuses on lower targets.
If you wanted to trade the intraday perspective, my bias is bearish until price can first hold above 8845.69, then more importantly above 8979.7, so for me, I’d seek shorting opportunities with unless price is able to hold above those levels.
I’m always in awe of harmonic rotations. Note that the completion of the intraday blue pattern at 9335.04 will help the Day chart push above its Line in Sand level 9310.20. Of course it depends on holding up there to increase the probability of touching those ABCD targets, and we also have scaling points at the blue targets on the intraday chart. Same with the intraday completion of the green pattern at 8162.66, this will help the Day GRZ bottom 8315.34 be breached and it’ll be a matter of holding below there to increase the probability of going to 6705.54. Keep in mind I consider scaling points as potential rejection or reversal levels and they do have the capability to prevent reaching the extreme levels in the near future.
Trading futures involves substantial risk & is not suitable for all investors. Past performance not indicative of future results