
$EWJ, the ETF for Japanese Yen is in between opposing emerging patterns on a Weekly chart. Traders are seeking some resolution of higher probability directional targets from a key level of 49.
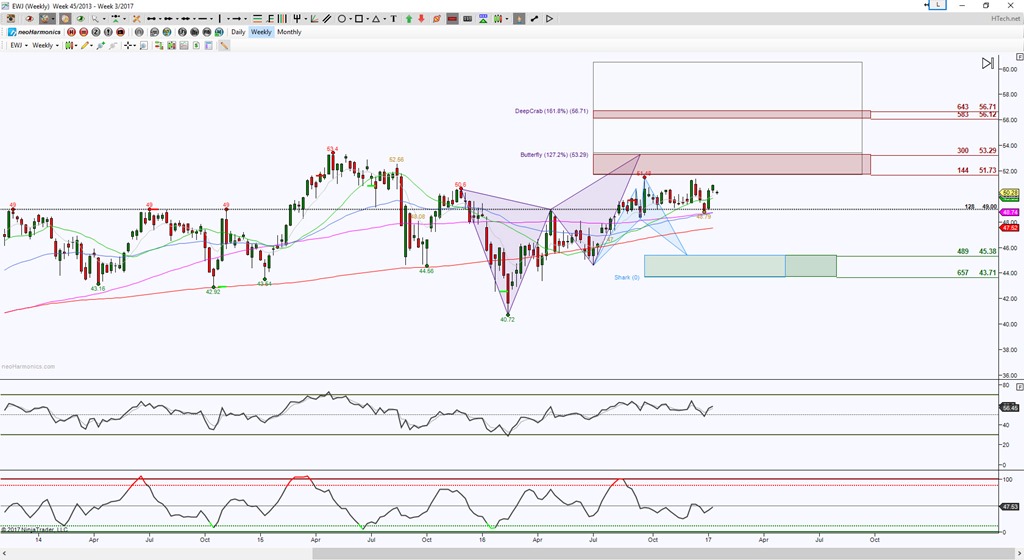
EWJ Week Chart
In the world of harmonics, certain Fibonacci levels determine ideal targets to complete a pattern. In this case, the green and red zones represent the targets for the completion of those patterns. As long as price holds above the 49 level, the pull is to complete the purple pattern, having ideal upside targets at 51.73 to 53.29 zone or 56.12 to 56.71 zone, these are decisive regions once tested.
A hold below the 49 level has an ideal target of 43.71 but the top of the zone is 45.38. The bias is currently to the upside although not a strong bias. This also implies either of the opposing patterns have a chance at this juncture.
The Day chart shows opposing emerging patterns as well. Of course multiple opposing harmonic patterns is indicative of price being in a form of consolidation or decision mode. I’ve left the Week chart zones and important level line of 49 on this chart.
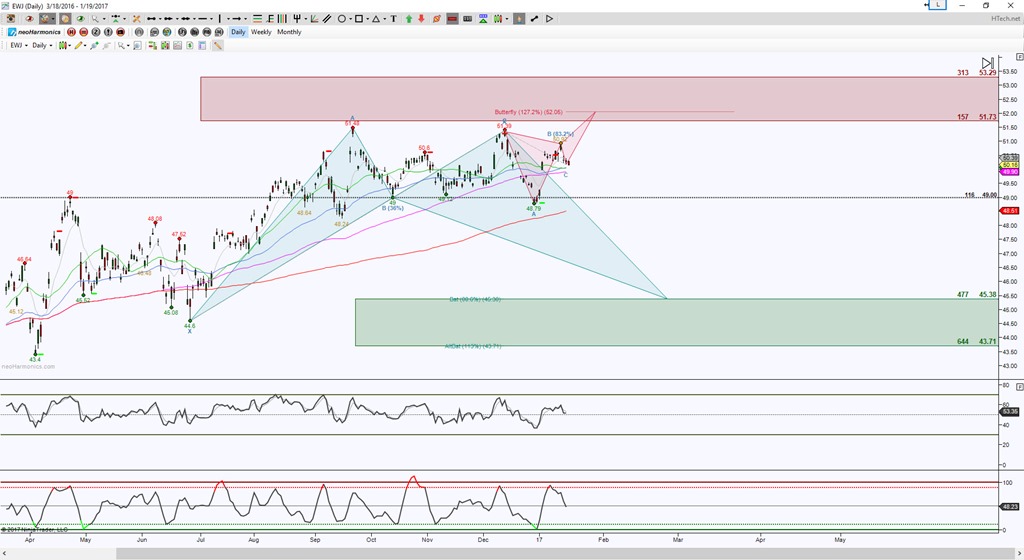
EWZ Day Chart
I’m always in awe of how harmonics work together. Notice how these smaller opposing pattern completion targets aka PRZ’s (Potential Reversal Zone) will help the Week patterns complete as well.
I’m watching the RSI to hold or not at its midpoint while price pulls back into initially a group of moving averages but that 49 is the primary support test. If RSI can hold above its midpoint and price can hold above 49, then the probability is to complete the patterns that merge around the 52 level. If RSI holds below its midpoint and price holds below 49, then the probability is to test the double PRZ target of 45.38 or 43.71.
Trading involves substantial risk and is not suitable for all investors. Past performance is not indicative of future results.