
The question is, can AAPL help XLK, the ETF for the technology sector, push downward to complete a harmonic pattern or can a small completed pattern in AAPL begin retracement mode to the upside to help XLK hold above an initial important resistance?
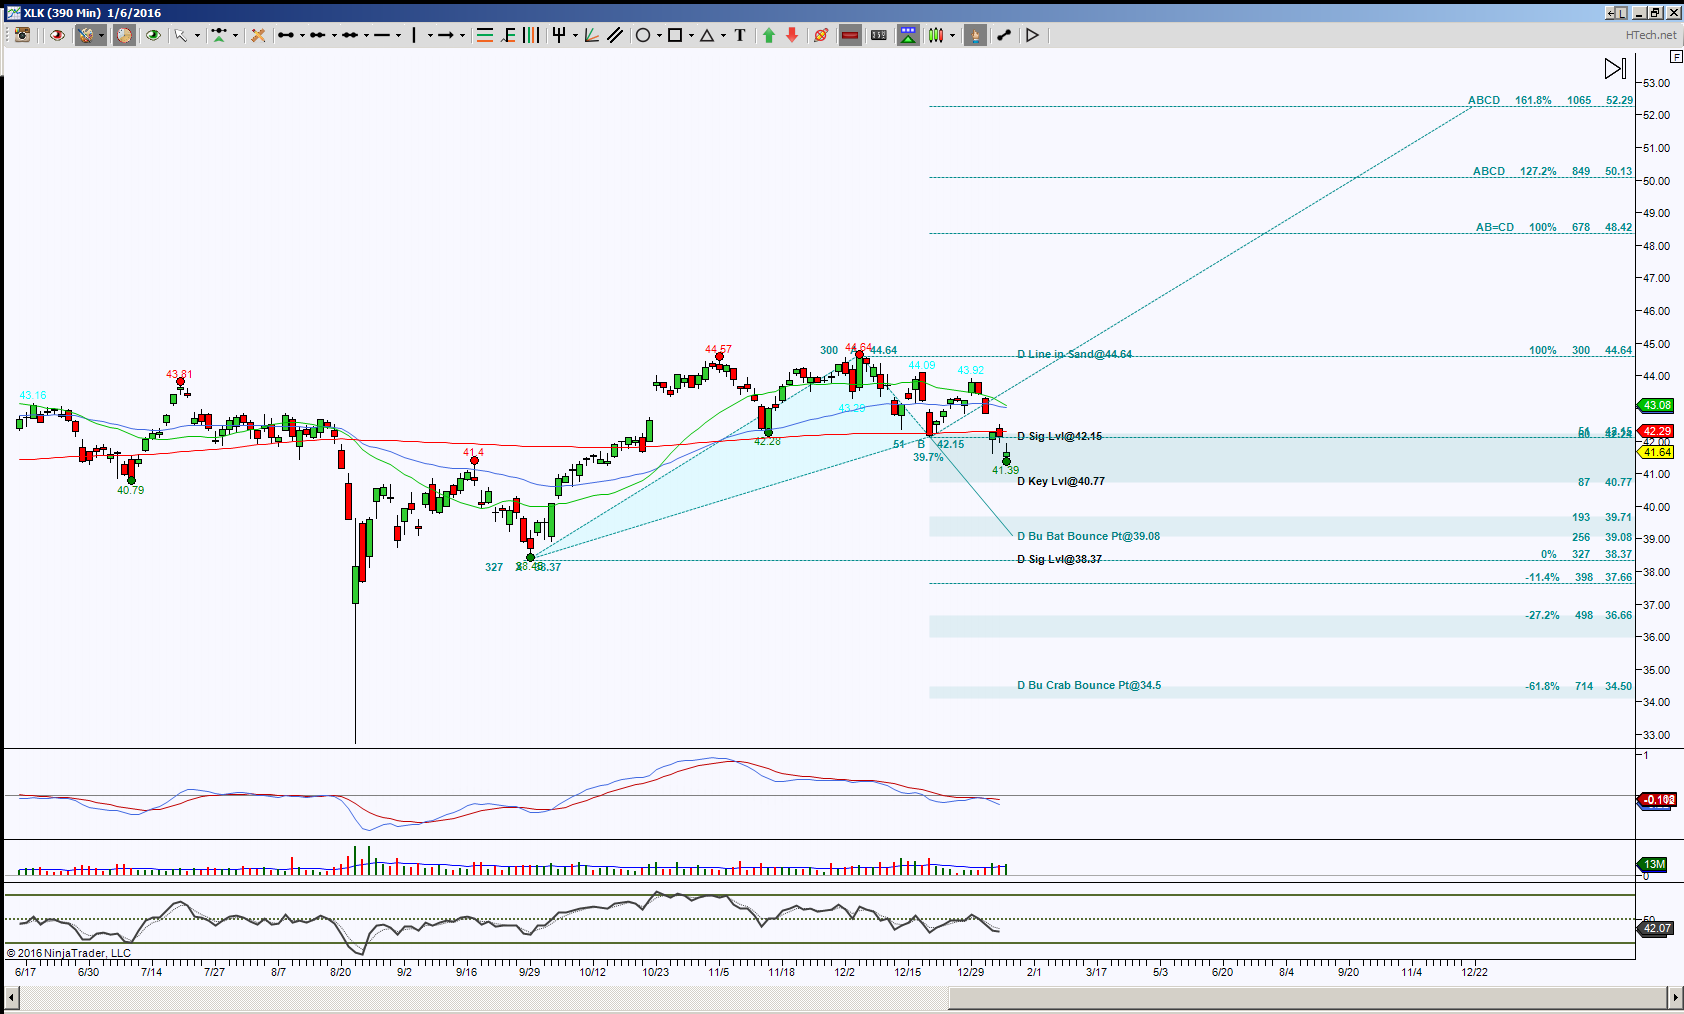
The XLK chart shows price gapped down on January 6, 2016, and the initial resistance test to hold above or below is 42.15. A rejection of 42.15 or more important a hold below 40.77 increases the probability of testing 39.08, this helps price test the bottom of the range 38.37, if price breaks down there, the next ideal target is 34.50.
The overall bias is neutral with a downside pull, but if the bulls can find some initiative and hold back above 42.15, then the bias returns to neutral and an upside pull or shift to an all out upside bias increases with a hold above 44.64.
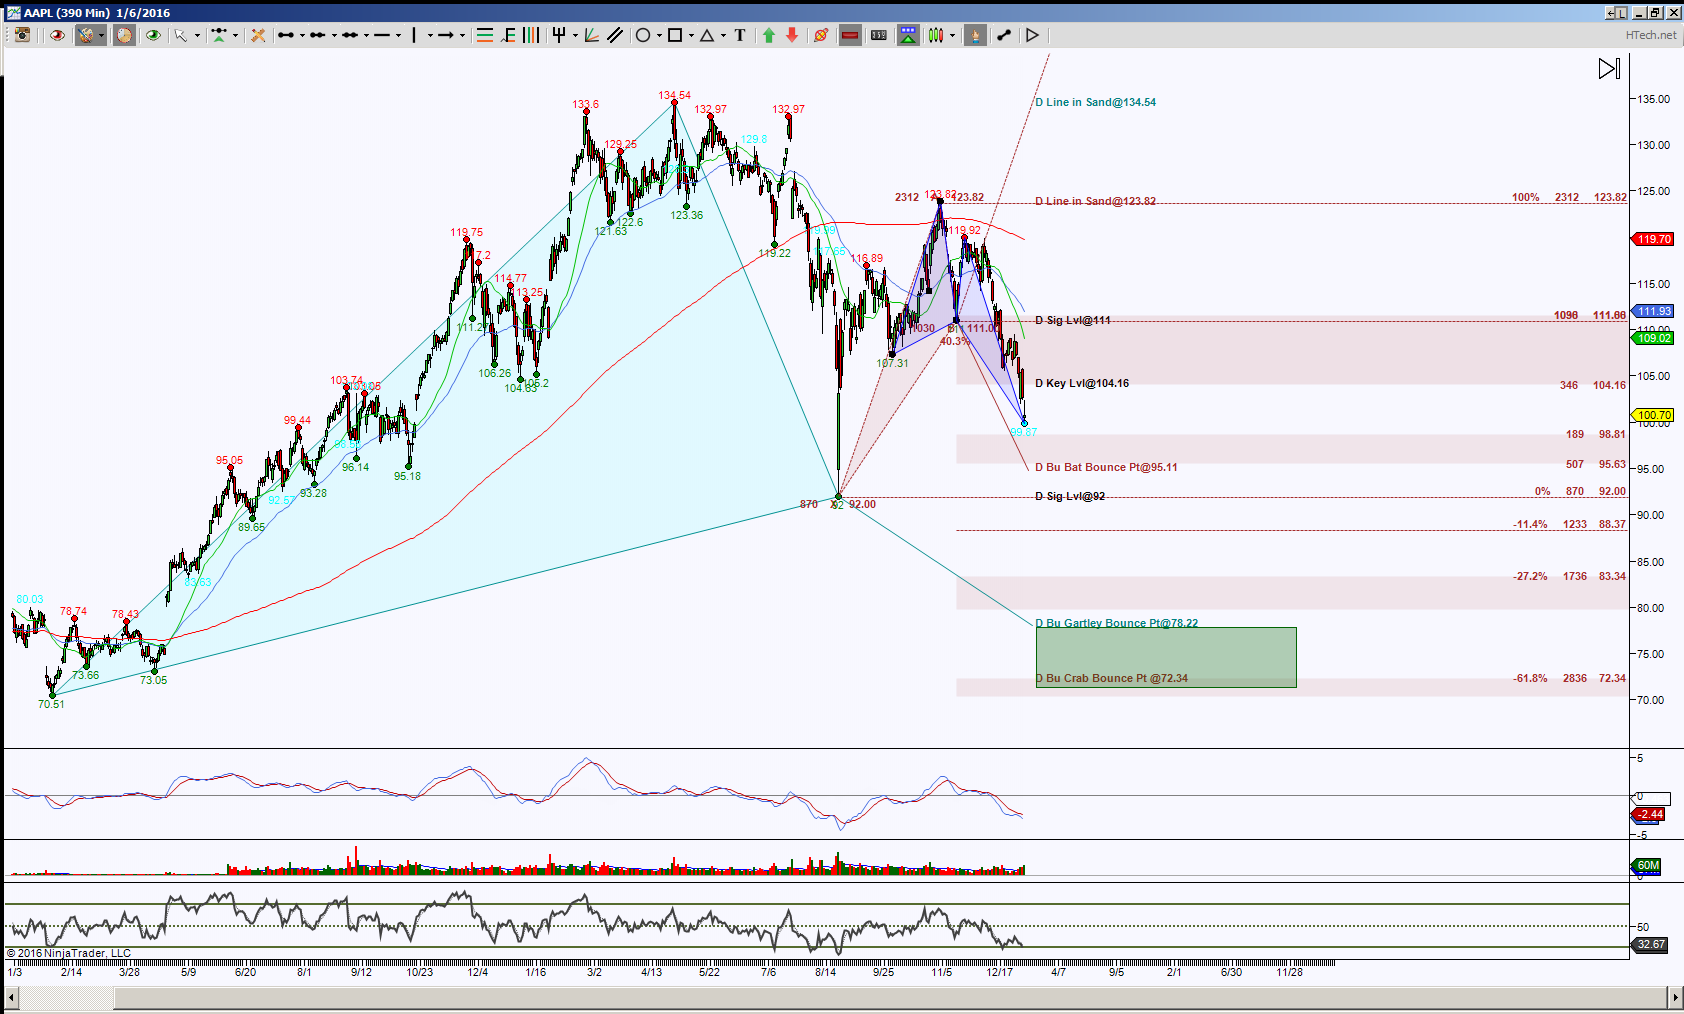
Since AAPL has a weight in the XLK ETF, it can help the XLK sector make a decision regarding it’s 42.15 level. The ideal harmonic scenario in AAPL is to complete a double harmonic pattern at the 78.22 to 72.34 region, this scenario increasing in probability with a break down of 92. But there is a small blue colored pattern that has completed at the 29.87 test. Now there are times that a small pattern can pack quite the punch, so don’t discount the potential of something small. However, this little pattern also has obstacles to contend with, initially 104.16 and then more important 111.
If price can push above 111, this will risk shifting the bias to the upside, increasing in probability above 123.82. If this is how it turns out, then perhaps it will help XLK hold back above the 42.15 region and seek higher levels. But a rejection of 111 or more important a hold below 104.16 does have 95.11 initial target with a potential breach to 92. Again, 92 is a very important support test and will determine if price stays in a range or fails to hold so that the double pattern can complete below 79. This scenario can also help XLK complete its extended harmonic pattern at 34.50.
Trading involves substantial risk and is not suitable for all investors. Past performance is not indicative of future results.