
The EFT for Biotechnology, IBB has been stalling at what I call a Significant Level. This is a decisive point for either a bounce or more downside for a Gartley completion.
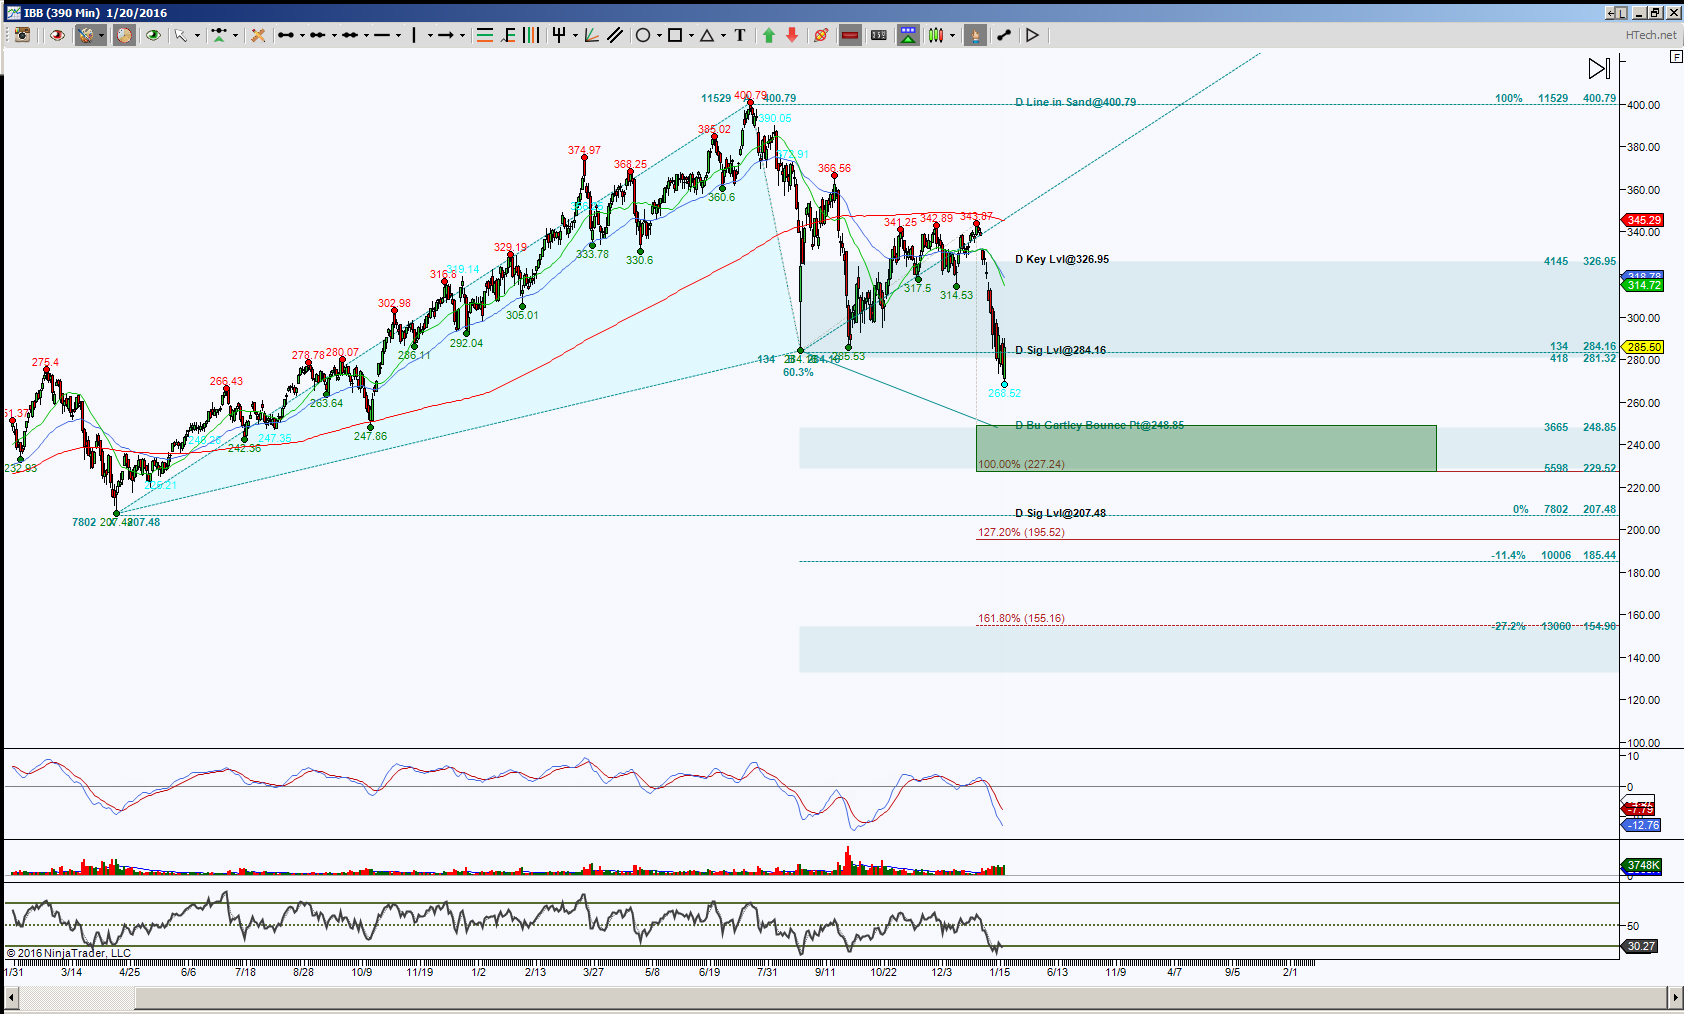 The Day chart shows 284.16 is the aforementioned Significant Level that price is stalling at. First the healthy scenario, if price can hold back above 284.16, it offers an upside move in an attempt to balance the extended price action and retest the 326.95 region. Providing price can get there gives an opportunity for upside pull, especially with a hold above 326.95, then the probability of retesting 400.79 increases. But unless price can hold above 326.95, the overall bias is to the downside.
Whenever there’s a decisive point, it’s a good idea to be prepared for more than one scenario, the other side of 284.16 is there’s an emerging Gartley pattern PRZ (aka completion target) at 248.85 with a potential breach to 227.24, this is the downside target with a hold below 284.16. This will be an opportunity for Bulls to step in for an upside retracement mode, how much if any retracement will be very important. One of the great things about harmonic patterns is there’s always areas of interest and targets for thinking outside the immediate box, as well as zooming in for micro views. So once price is inside the green colored PRZ, I’ll be watching for a break and hold beyond the zone, that will be my trigger for initial bias. Downside continuation has the ideal target of 88.01 and scaling points at the cyan and brown levels with emphasis at 155.
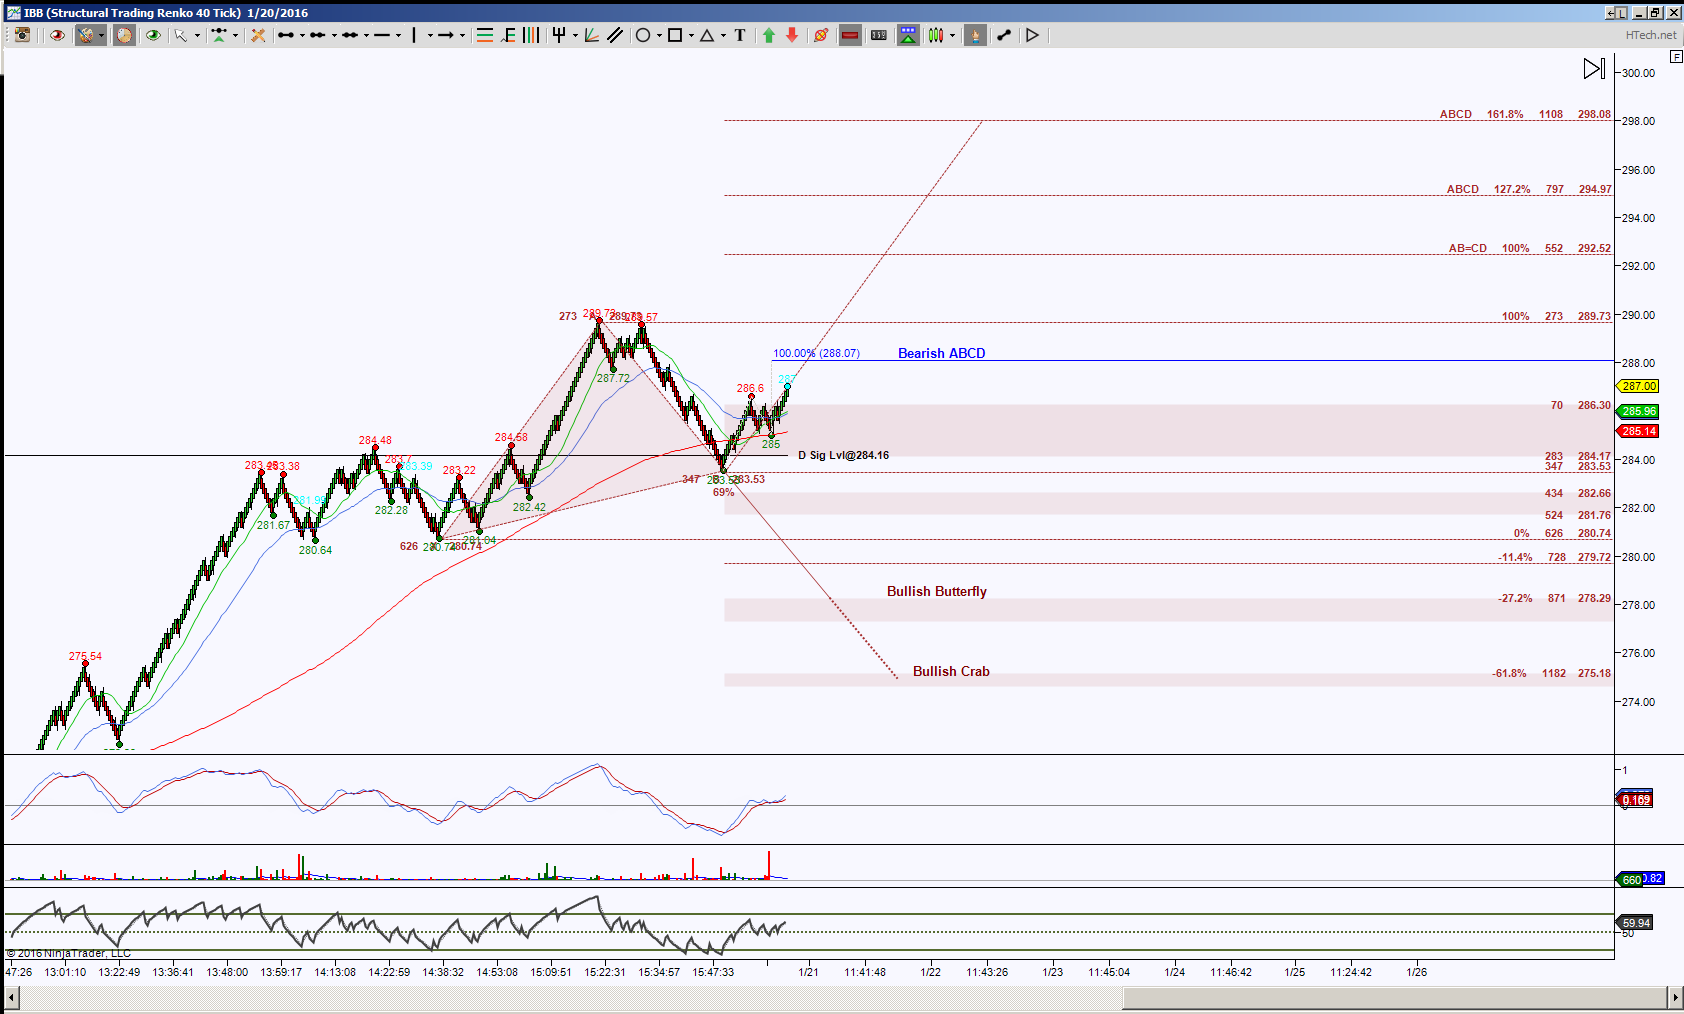 To zoom in what’s happening at the 284.16 level, I’m looking at an intraday perspective, in this case an STRenko 40 bar chart. I’ve left the Day level on this chart for perspective purposes. As you can see even though the day chart has downside bias, however due to expansion, there’s probable stall or bounce and this chart is favoring the bounce attempt. The brown colored pattern is duel, showing opposing emerging patterns with 289.73 as the Line in the Sand, meaning above it has the brown ABCD targets but as long as price holds below 289.73 the emerging Butterfly remains in play.
The initial levels to break and hold are above 288.07 for that 289.73 target or below 286.30 for a retest of that 284.16 target. Once that’s determined I’ll be watching for the upside 289.73 test or the downside 280.74 then 278.29 or 275.18 targets. Basically these are harmonic patterns in the works to help the Day chart harmonic rotations play out.
Trading involves substantial risk and is not suitable for all investors. Past performance is not indicative of future results.