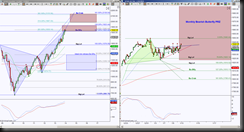
SPX is testing a monthly bearish Harmonic Pattern PRZ (Potential Reversal Zone). This zone is from 1823.42 to 1923.44 and currently price is holding inside the zone. As long as price holds inside the zone it implies an attempt to test as many levels as it can inside the zone, this is a bullish bias, however, this is considered a bearish zone and if price holds below the zone, the bias shifts into retracement mode of the Harmonic Pattern, thus bearish.
A monthly pattern is much stronger than a 5 minute pattern, but it’s important that if you’re an intraday trader to wait for an intraday setup rather than a monthly setup to enter a trade, even though a monthly setup is unfolding.
 The left side of the chart shows the monthly Harmonic Pattern scenario, the story that is unfolding in this chart is that price is testing a bearish zone and that price is extended from faster moving averages (this offers a visual gauge of ‘time to rest/stall’ or ‘ time for a pullback’).
An aggressive Harmonic Pattern trader could enter a short position here knowing that the risk is above the zone at 1923.44. If this risk is too much then the conservative approach would be more ideal, meaning patience is a requisite and the trader would have to wait for price to hold below 1823.42 before entering a short position, then the risk is either above the current high or above the bottom of the zone which is 1823.42 which is much less risk.
One of the biggest deceptive beliefs is that there is a 100% guarantee in setups, this is very dangerous especially for a new trader that is still finding their risk tolerance because it creates a mindset of “I have to be right” and this can blow out an account. So with that thought, keep in mind that though this monthly chart has a probability of being at a rejection point, the fact is, often one Harmonic Pattern’s completion is merely a means to an end or to a higher PRZ, in this case that would be 2138 for the higher PRZ target.
Typically if one is trading off of a monthly setup, the entry can be fine tuned in a day chart or 4 hour chart. The chart on the right is an hour chart, I chose this timeframe for an intraday trader with the monthly PRZ visible for educational purposes.
So this is how this works, whether you trade SPY, S&P Emini futures or SPX itself, price is at an interesting juncture on a large timeframe. The hour chart is a large timeframe from an intraday perspective and this chart has an emerging pattern, also a Butterfly Harmonic Pattern and has been in a sloppy mess as easily visible with the upside red dots and downside green dots (these are derived from specified swing data).
The scenario for the hour chart is that price is pushing above a blue trendline that has held as resistance and offers a bullish bias while forming a leg of the Harmonic Pattern. An important resistance test will be 1849.44, this is a line in the sand level for the green pattern and as long as this price is not breached the green pattern remains in play.
If this green Butterfly / Crab pattern will be valid, the 1849.44 will not be breached and the completion of the pattern will require a downside move for its conclusion. The completion of both the Butterfly at 1810.11 and the Crab at 1799.41 will be a hold below the monthly PRZ.
So for intraday interpretation, a pullback and hold above the blue trendline offers a long opportunity with 1849.44 being a place to take profits, protect profits or stalk a reversal position. Of course if price holds above the 1849.44 the bigger target is the top of the monthly PRZ.
A rejection of the 1849.44 or hold back below the blue trendline offers a short opportunity to retest the red trendline or more important, the significant level 1825.14. Note this hourly level correlates with the bottom of the monthly PRZ so a hold below there is big on both the intraday and long term perspective.
