
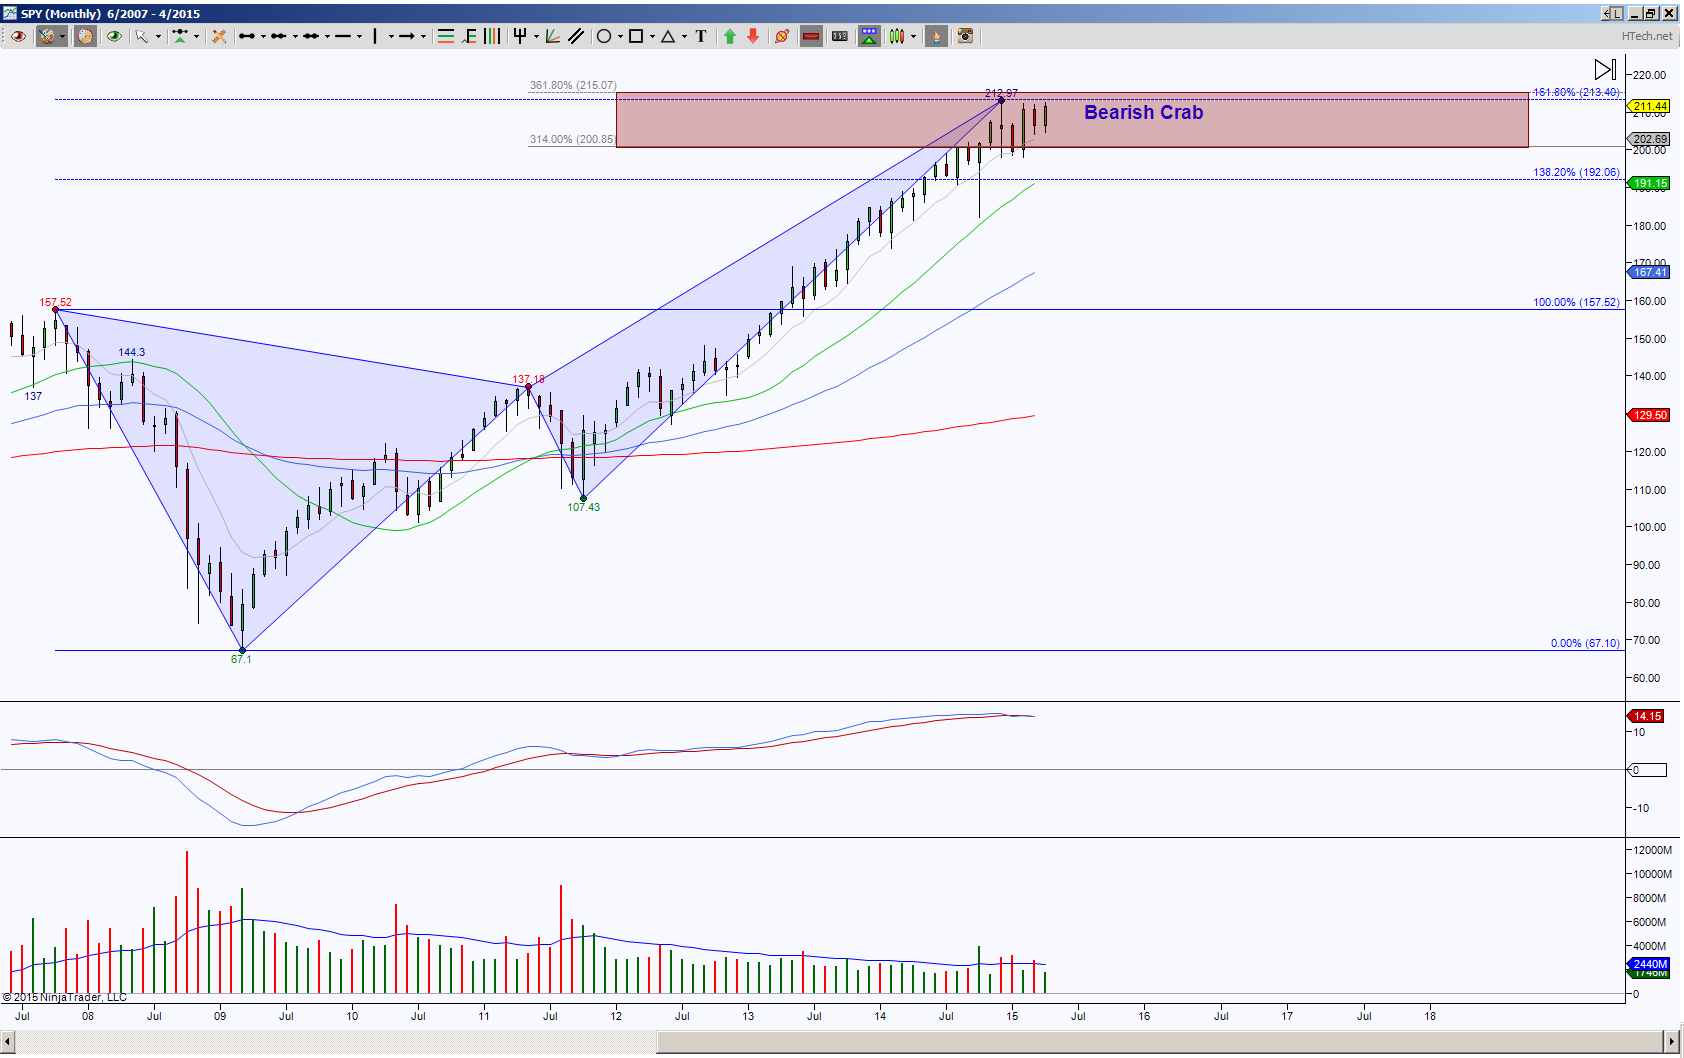
The SPDR S&P 500 ETF aka SPY had been crawling upwards since the 2009 low but has been tapering more towards the sideways motion since November 2014. The markets are cyclical and breath in and out. SPY has been exhaling for so long, it’s been trying to catch its inward breath during this period.
The monthly chart shows price is stalling at a very large bearish Crab PRZ (Potential Reversal Zone). It took years to complete this pattern and ideally I’d like to see all the levels of this PRZ to be tested, meaning 215.07 is standing very lonely until price meets it. In the world of harmonics, the break and hold beyond the PRZ is what I’m looking for. This could take a day, a week, a month or years but once price has conviction to hold below the PRZ, then there are very distinct downside targets, for a start I’m looking for 192.06, 157.52 and 137.18.
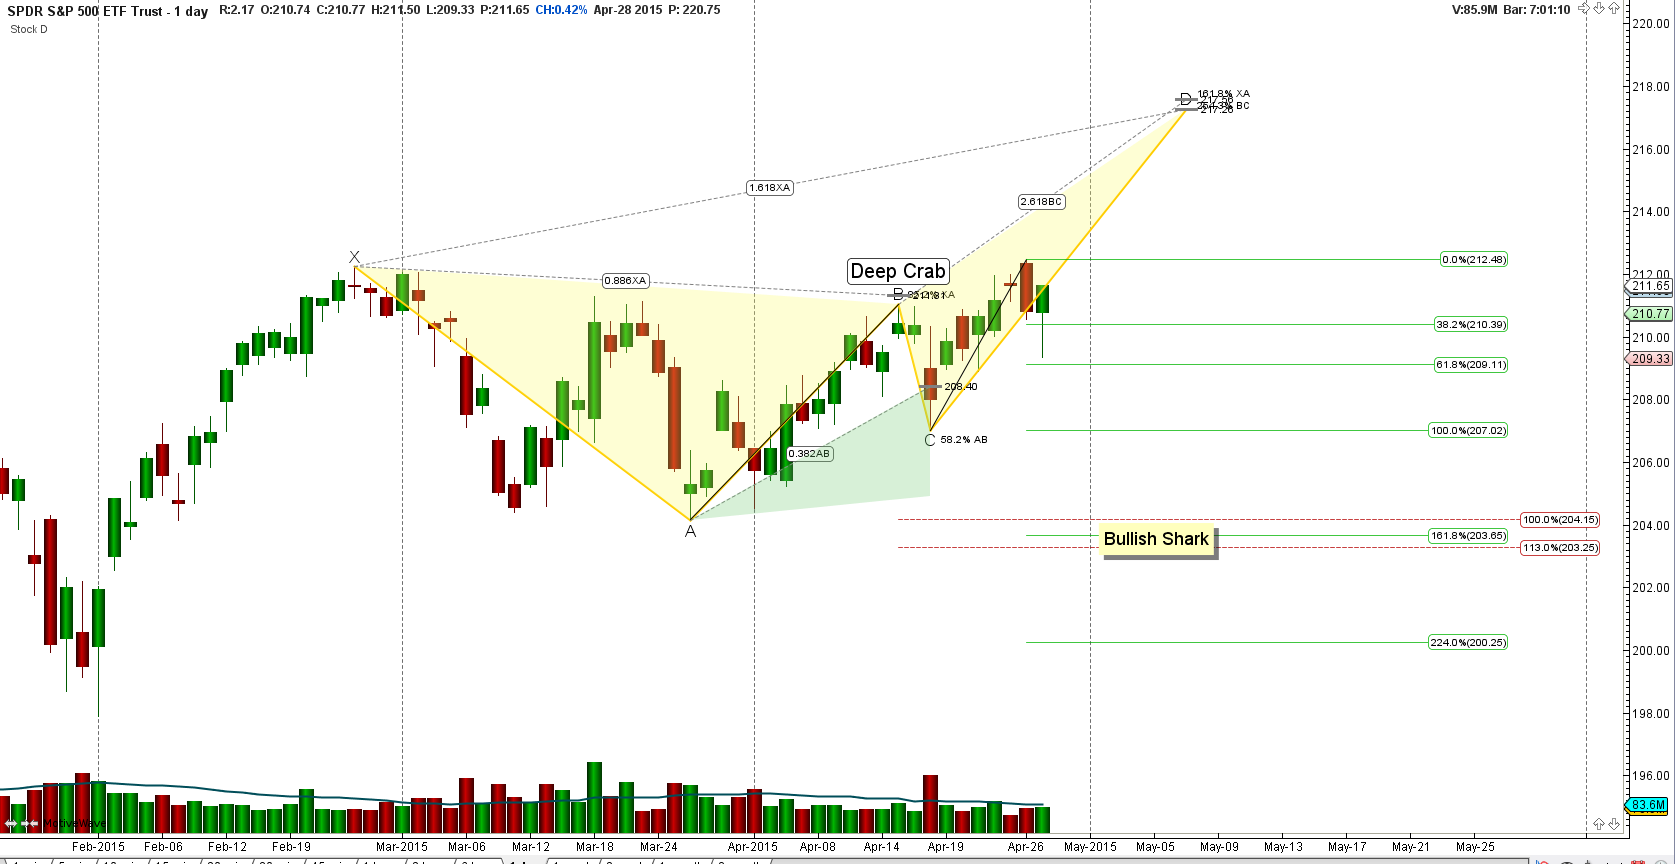
 On the Day chart, price is in between opposing emerging harmonic patterns, which is indicative of a consolidation as seen inside the Monthly PRZ. The initial important level to watch where price is in relation to it is 211.04. A hold above it has the ideal target at 217.56. Now this would be a breach of the top of the PRZ and that’s ok, what would happen after the breach is what would count. A hold below 211.04 has the ideal target zone of 204.15 to 203.25 and has scaling points at the green fibs noted on the chart.
 So the Month chart shows contraction, the Day chart shows current indecision, what about the Intraday chart for some clues for that 211.04 level? In this case, I’m using an hour chart and wouldn’t you know it, it too has opposing emerging patterns.
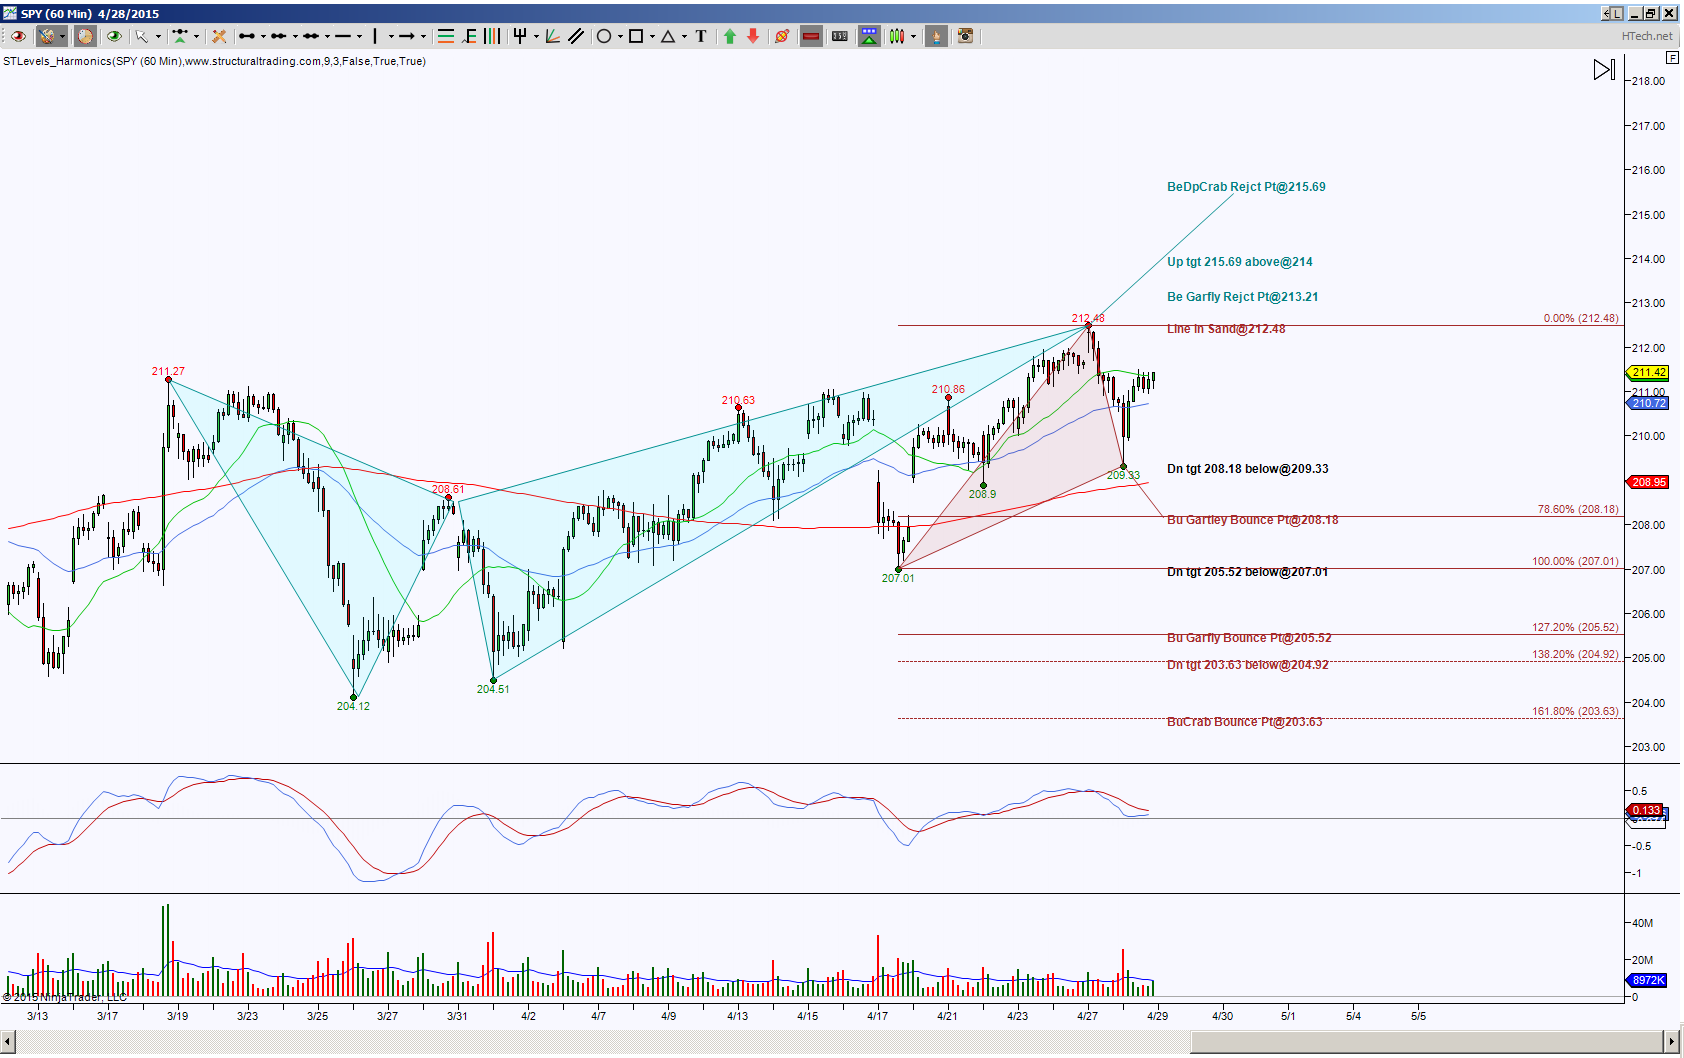 This chart has intraday upside bias unless price can hold initially below 210.72, then 209.33 but more important below 208.18. There’s noted downside targets should these levels fail but the flip of the coin right now says the first attempt to retrace that cyan colored bearish pattern has been very shallow, this suggests another go to test the top of the PRZ at 213.21. There is a potential breach to tag 213.56 or 214 but what happens after that is key as to which side of the PRZ price can push off of. Note the extended upside target of 215.69 correlates with the top of the Month PRZ. Harmonics, they always give me a sense of awe.
Trading involves substantial risk and is not suitable for all investors. Past performance is not indicative of future results.