
What’s fueling crude oil? In my best Church Lady voice (character from Saturday Night Live), “Could it be … harmonics?”
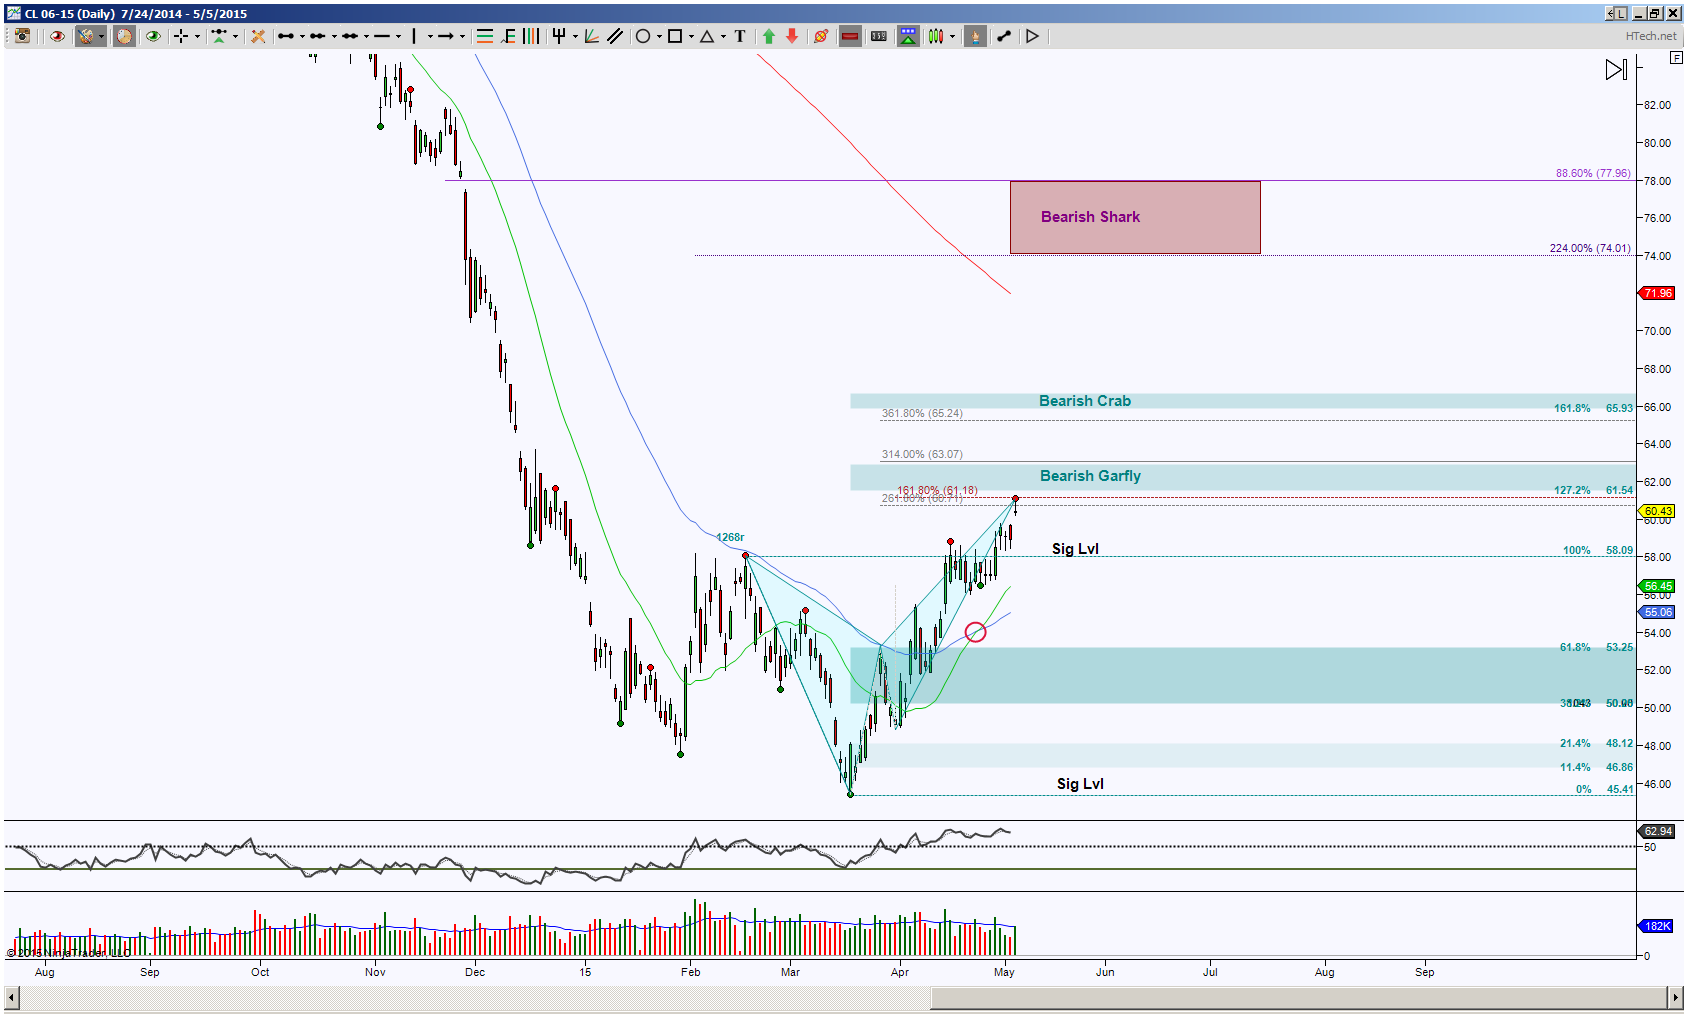
Crude oil futures, current month contract CLM15, has been in a freefall since June 2014. The day chart shows that there’s a bullish cross, a moving average cross trending trigger. There hasn’t been a bullish cross for almost a year, this recently occurred when price pushed through a harmonic significant level 58.09 in an effort to complete a harmonic pattern. There are three immediate targets, harmonically speaking, at 61.54, 65.93 and 77.96 and price is already testing the initial PRZ (Potential Reversal Point aka the harmonic completion target zone) level of 60.71.
So, in the world of harmonics, price has been reaching upward to fulfill these harmonic rotations. Typically the initial test of a PRZ will reject it, this is caused by harmonic pattern traders taking profits at a designated target, and since price is extended, the probability implies either a stall or pull back into support. The ideal pull back targets for a bull is 58.09 to the maximum target of 55.06, anything below there risks shifting the bias to neutral or to the downside. But as long as these pull back targets hold price up, the bias keeps to the upside while the consensus is to be aware of behavior at each harmonic pattern’s PRZ. In other words, when price tests these PRZ’s, the primary 2-part question is does it retrace from there and if so, how much.
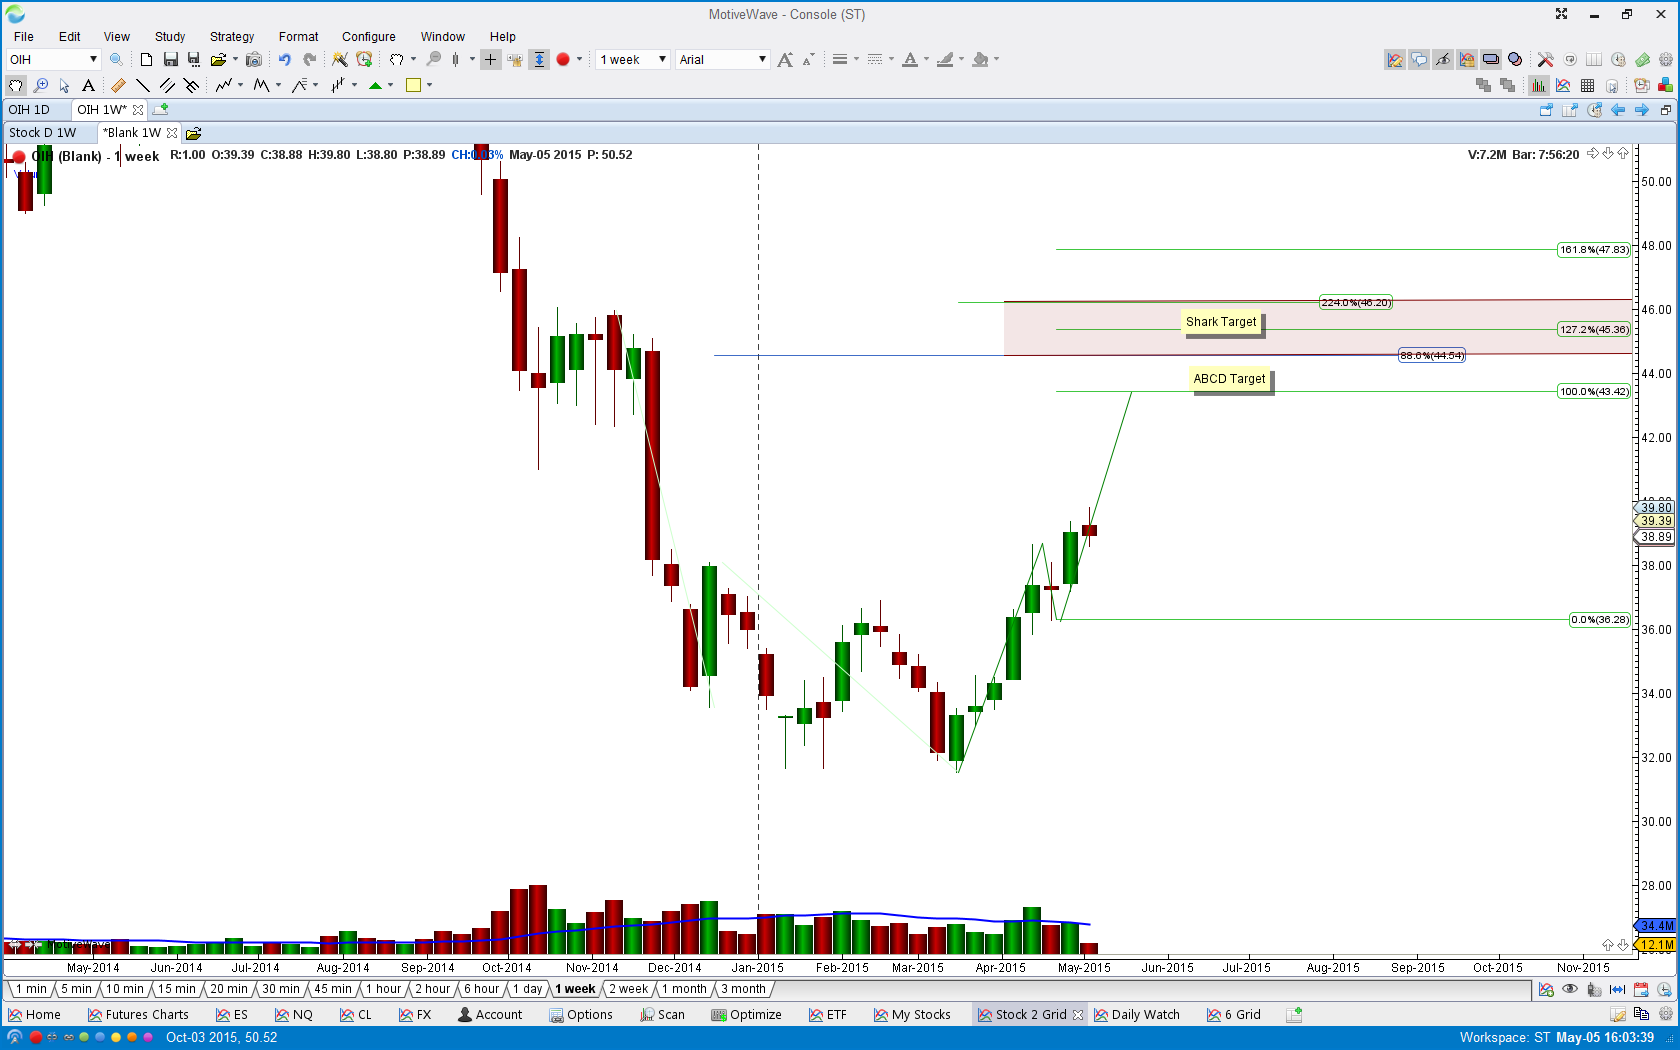
Notice how there is a Shark pattern target about midway up from that June 2014 high to the March 2015 low? If you’d rather trade an ETF versus a futures instrument, then observe OIH for example, this too, shows price has a Shark PRZ about midway from it’s extreme high and low. In this case, I’m using a Week chart and there is a double PRZ between 43.42 to 46.20. A double PRZ means there’s two different harmonic patterns that complete at a common area.
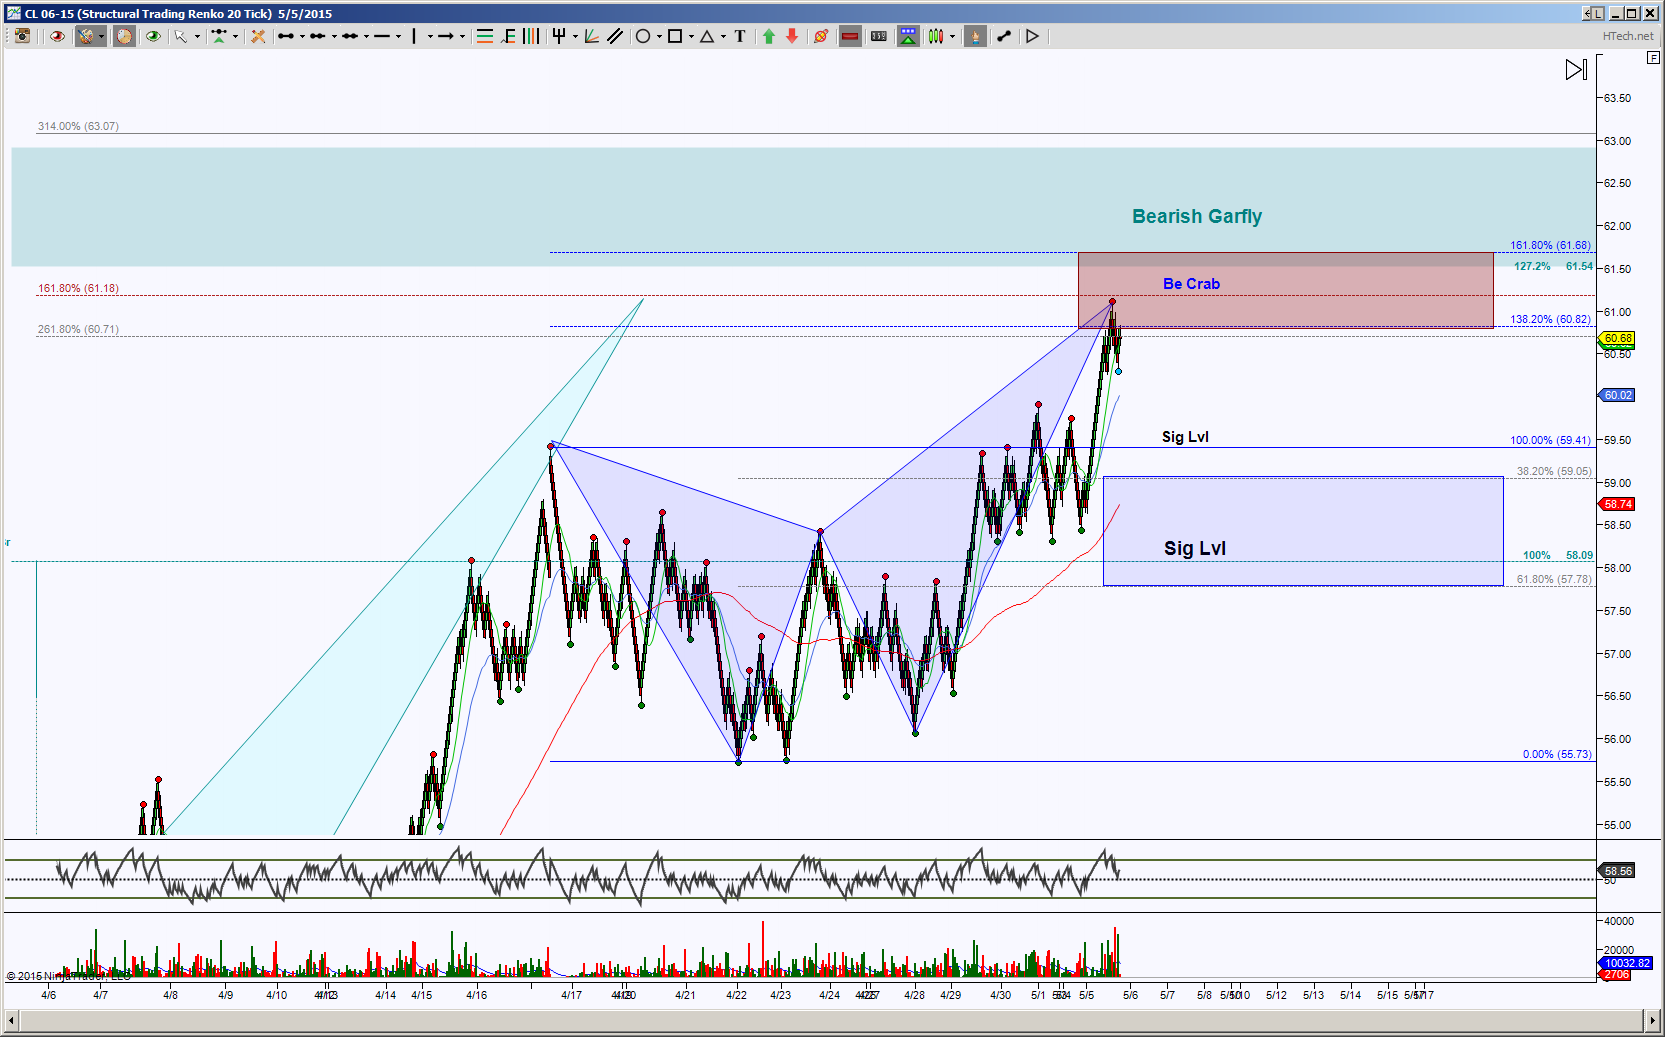
On an intraday view, I’m using an STRenko 20 bar chart, I’ve left the Day levels on there. There was a blue colored harmonic pattern complete smack dab inside the initial zone of that Day PRZ, and price is attempting to retrace this blue colored Crab. The retracement targets are 60.02, 59.41 and it’s ideal minimum target at 59.05. Notice this puts price in the vicinity of the Day chart’s pull back targets.
I’m using an hour chart for the OIH intraday perspective. This also shows a completed harmonic pattern which is attempting to retrace and approaching its ideal minimum target of 38.45.
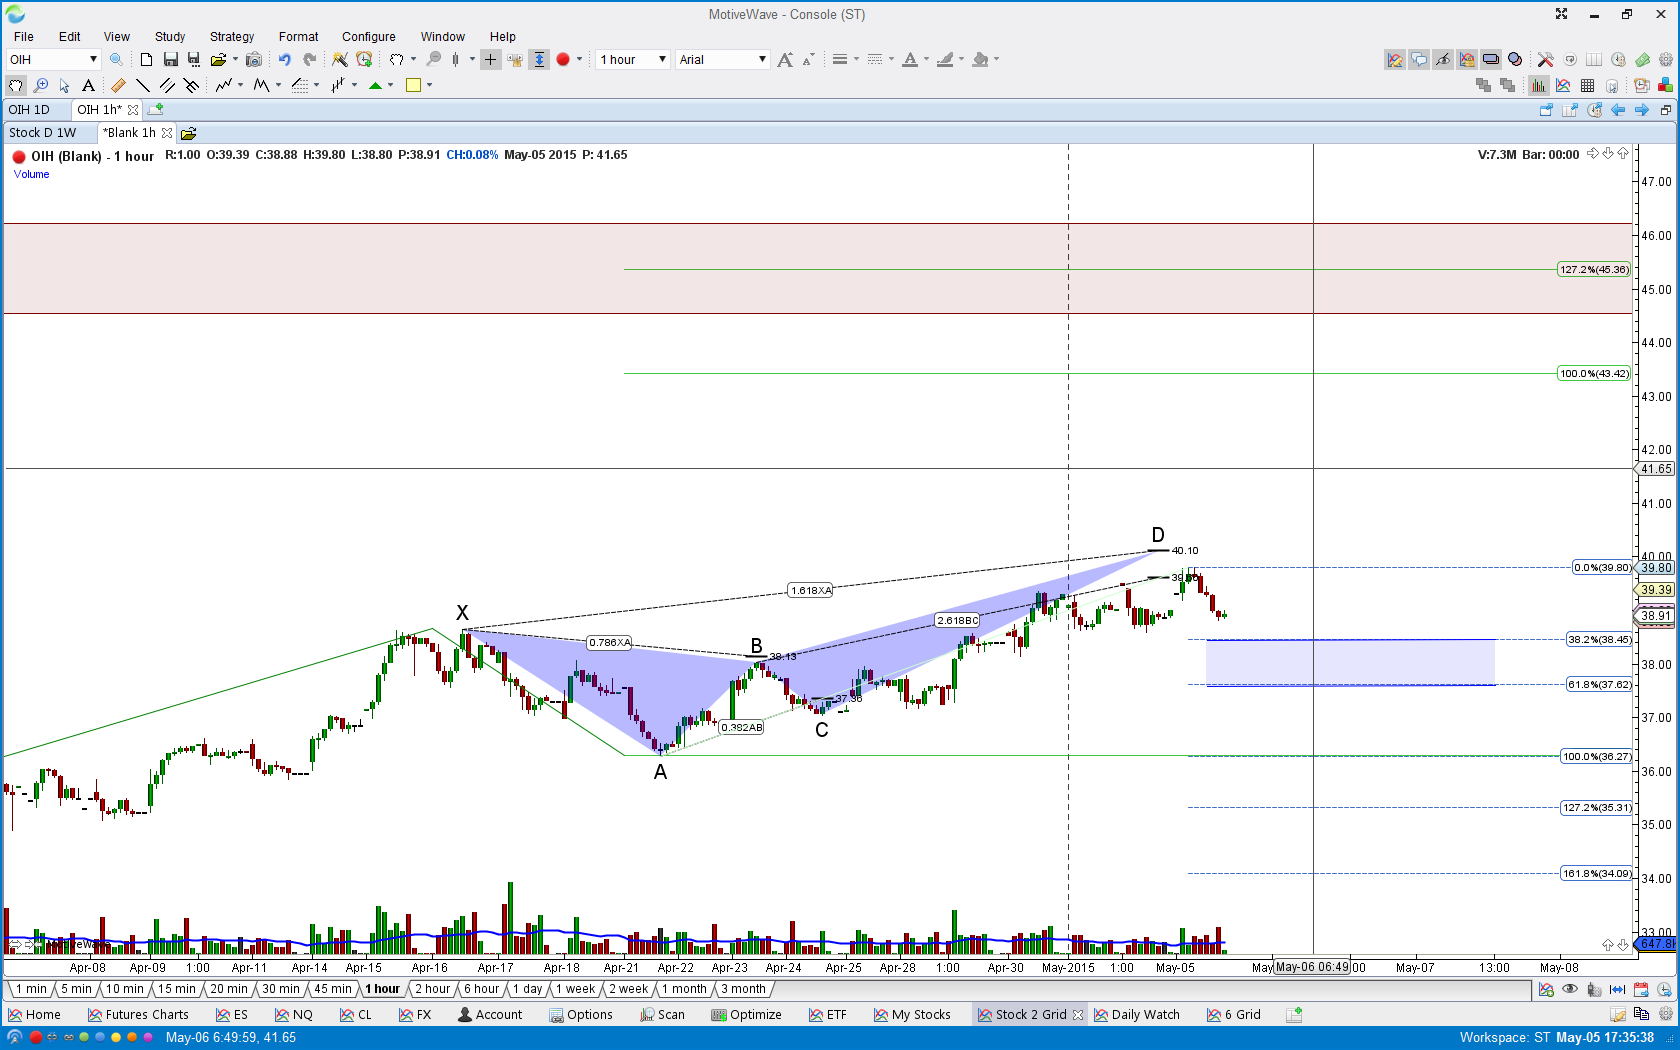
These intraday charts have the same scenario as the day and week charts, these pull back or retrace targets will be very important support tests, if tested of course. A hold above these targets implies to rev up the engines for higher prices.
Trading involves substantial risk and is not suitable for all investors. Past performance is not indicative of future results.