
I’m looking at two different Technology ETF’s. The first having to do with inanimate components like computers, software, internet, etc.
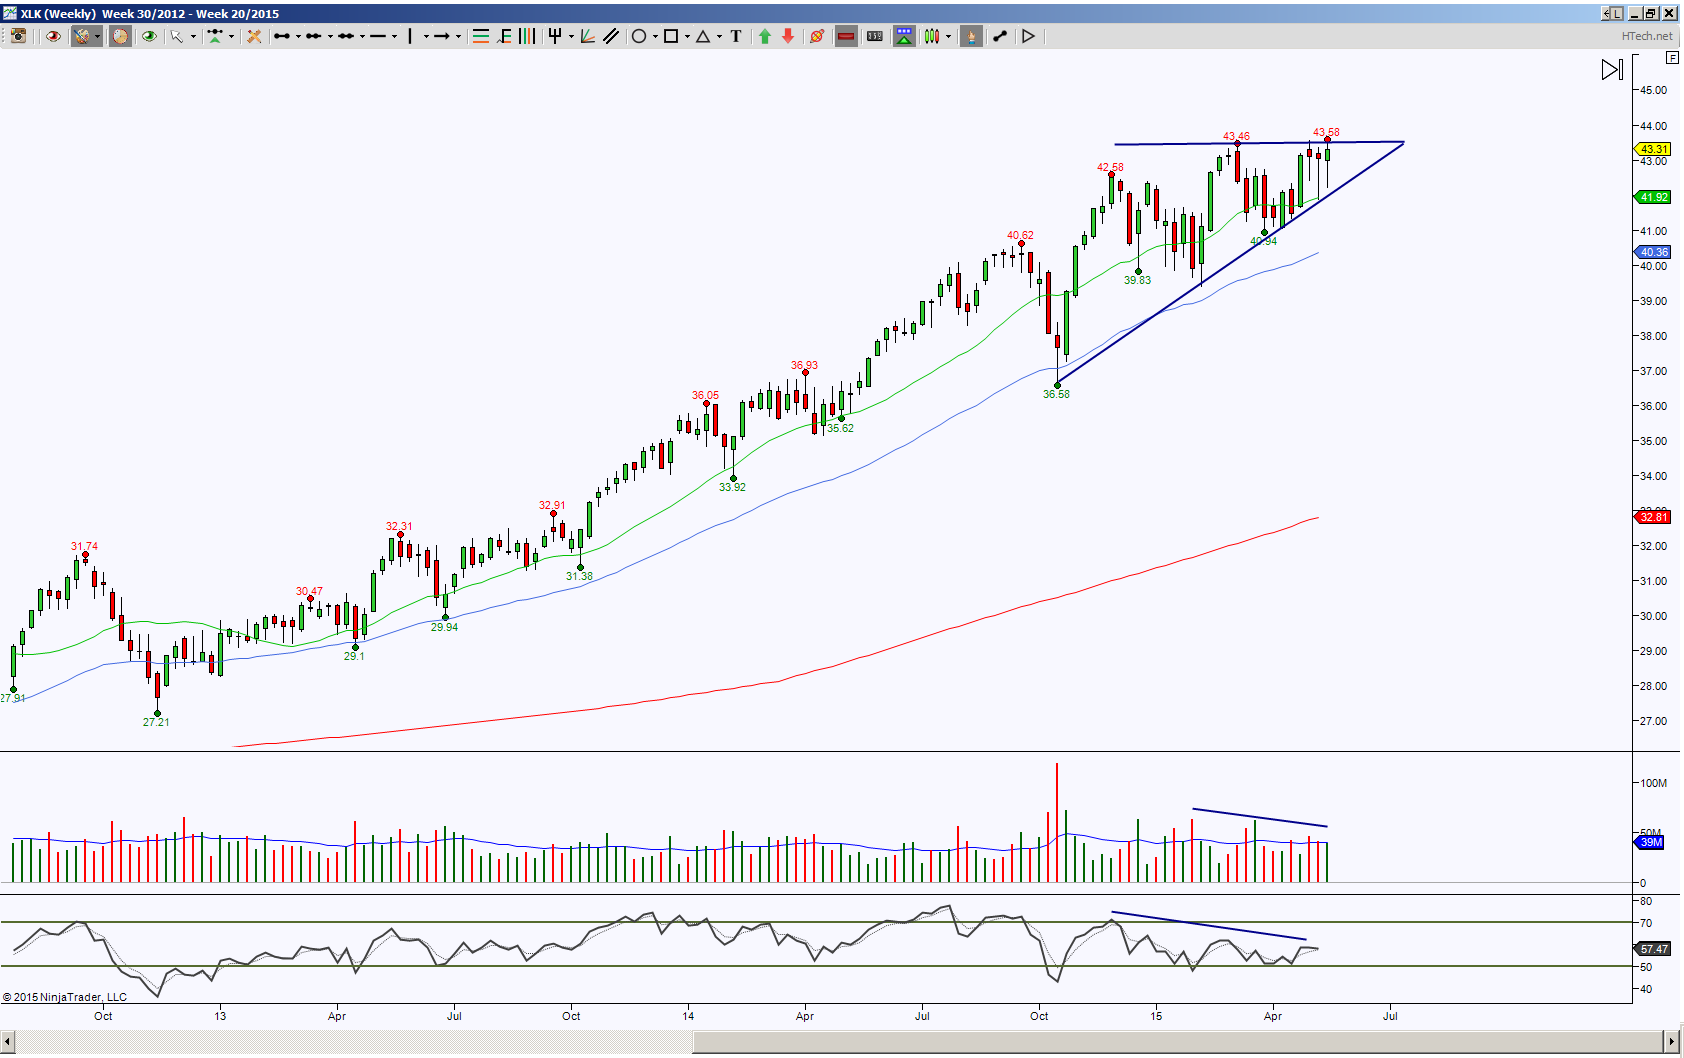 The XLK week chart shows price has been in an uptrend for quite some time, but has begun to consolidate in an ascending triangle. Typically an ascending triangle is bullish but the edge is so slight that one must be prepared for a break down of the contraction as well. There is negative divergence with the tests of the resistance line. Regardless, I’d want to see some oomph with a break otherwise I’ll look for a confirmation of it.
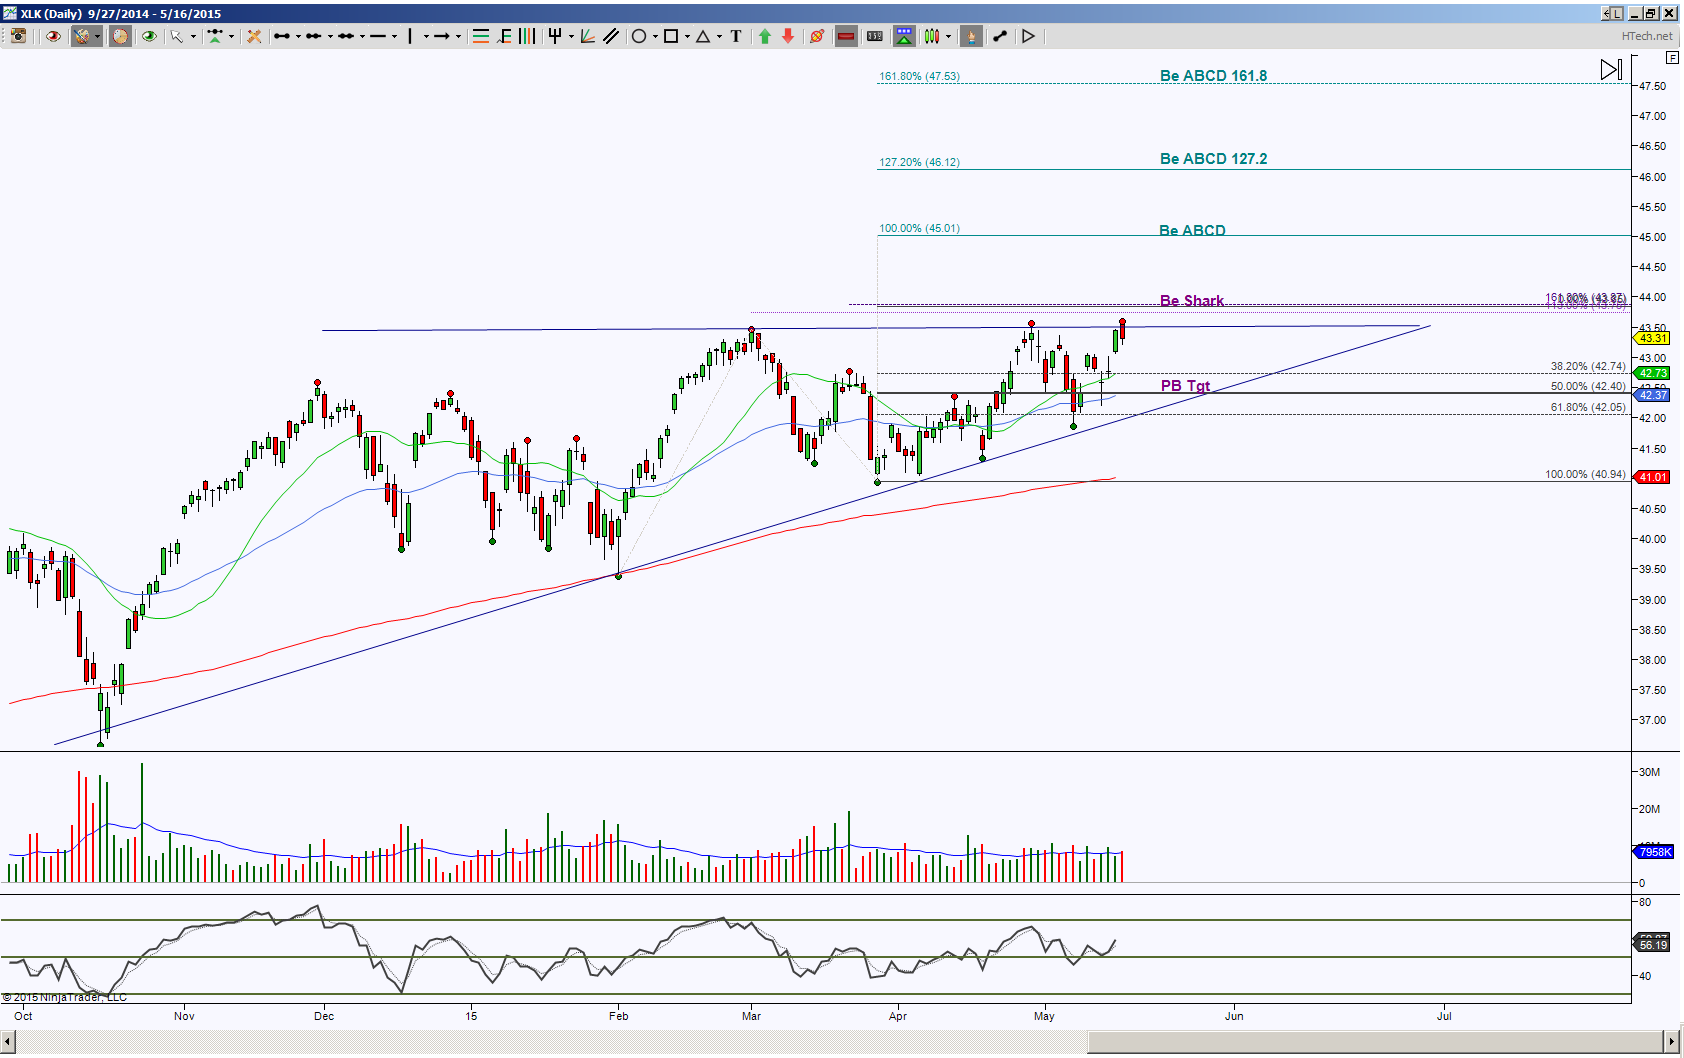 Viewing a Day chart, I did keep the ascending triangle lines on the chart for perspective. This chart shows there’s a potential breach of the triangle resistance line to complete a Shark pattern. This will be an important resistance test at 43.87 area because a valid Shark likes to retrace either 50% at 42.40 area or 100% at 40.94. Note that the half way back retracement correlates with my bullish cross as well as a retest attempt of the triangle support line. Should the Shark PRZ (Potential Reversal Zone aka the harmonic pattern completion target) be an upside target in route to higher targets rather than a reversal point, then the noted ABCD levels are the targets.
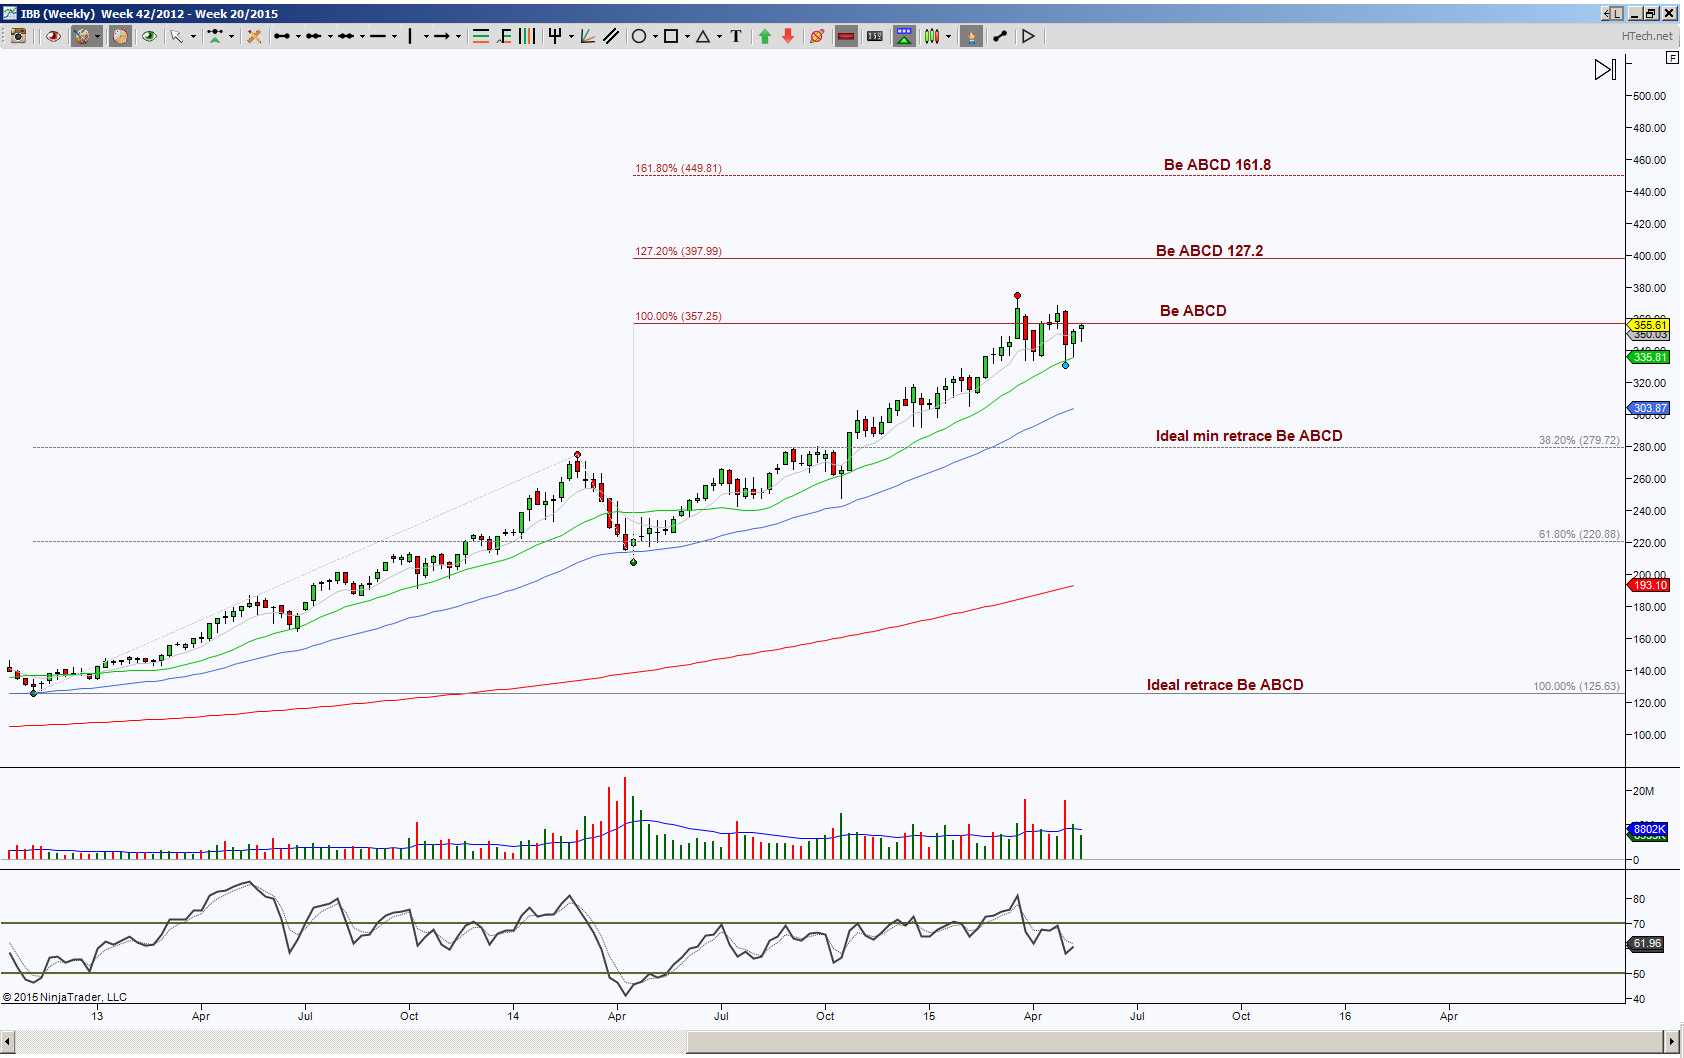 As for the animate ETF, what’s your poison or cure? The biotech’s have been making break-throughs in treatments for diseases. The IBB ETF Week chart shows there’s been a nice uptrend but price has been stalling at a Bearish ABCD PRZ. So 357.25 becomes an important gauge as to whether price has upside continuation to the extended ABCD targets or attempts to go into retracement mode. The ideal minimum retrace target is 279.72, keep in mind that even if price pulls back to this target and it holds, it’s still a good sign for upside continuation.
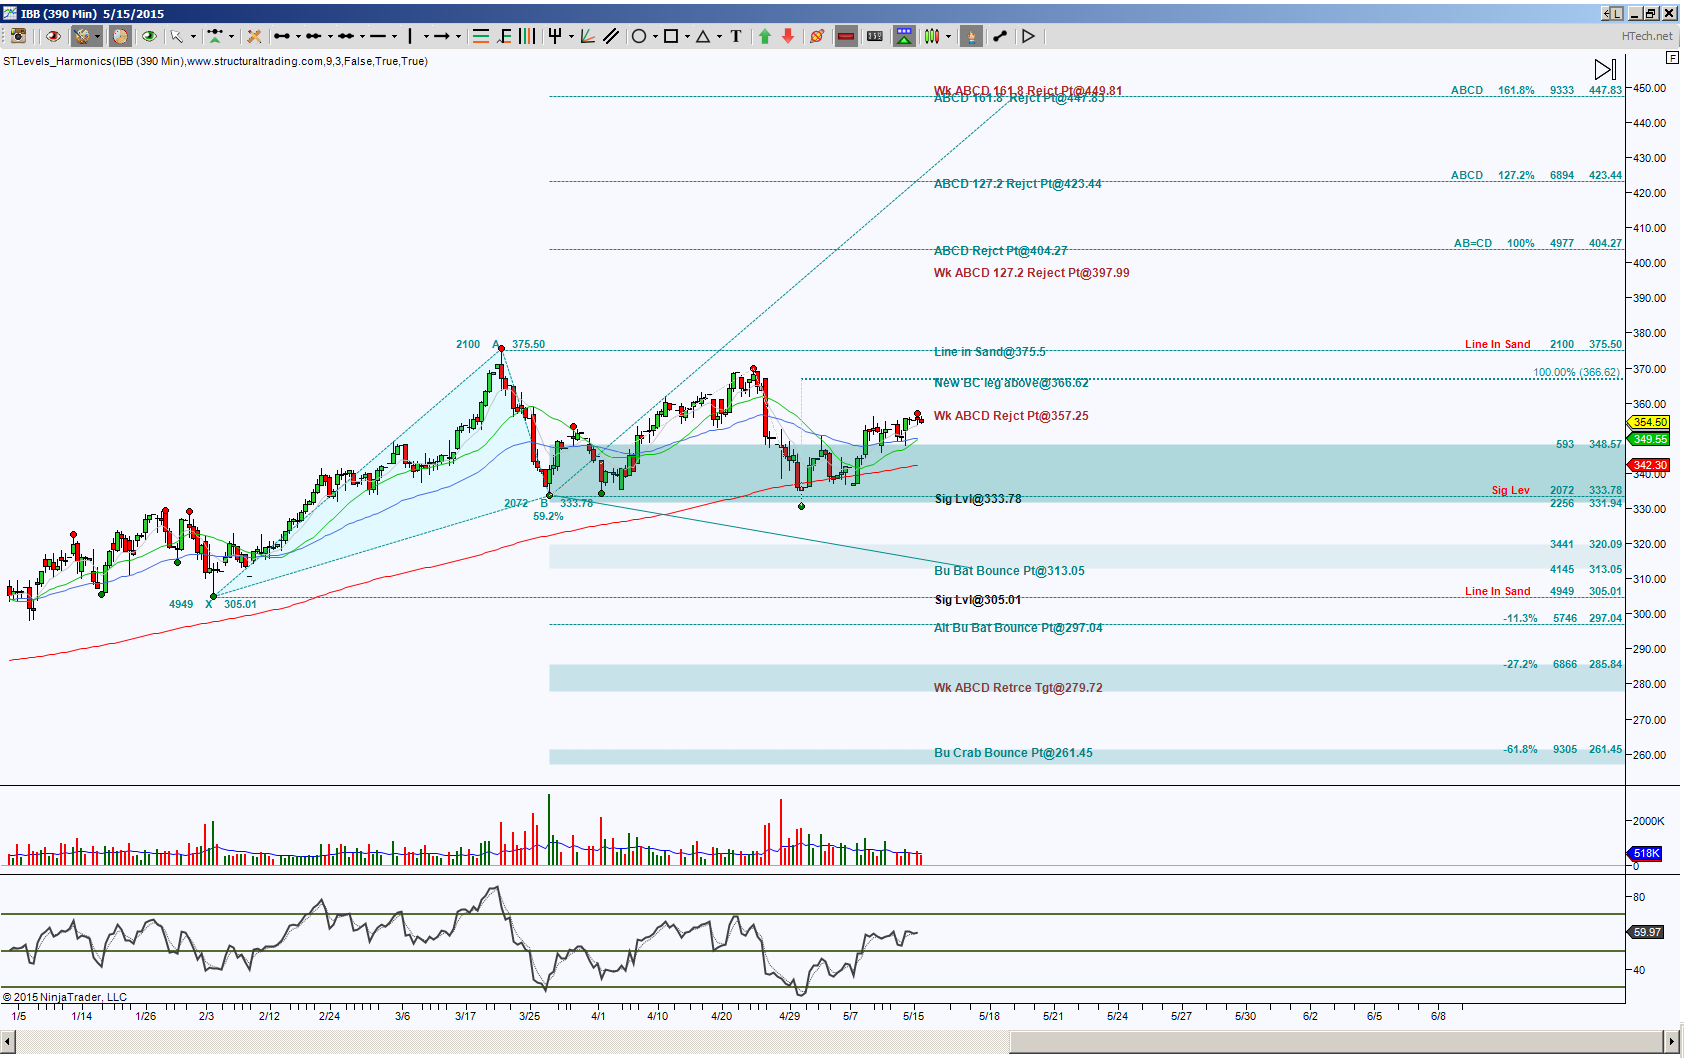 Taking a zoomed view of what’s happening at the Week stall, I’m using a Day chart. This shows that price is in between opposing harmonic patterns and the line in the sand between the two is 375.50. This chart shows there’s upside bias but lacking o0mph behind it. There’s a potential pull back to test 348.57, this is pretty key on this timeframe to hold as support or not, if so, then my next areas of interest are 366.62 and 375.50. A push and hold above the line in sand level 375.50 increases the probability of testing the day and week ABCD targets with emphasis at 448 area which is a double PRZ.
Should price be able to hold below 348.57, then the bias has risk of shifting to the downside and increases the probability of testing the bottom of the Week’s stall support. This correlates with the Day chart’s PRZ target of 313.05 or 297.04. Note a completion of the extended pattern at 261.45 will help that Week ABCD test its ideal minimum retrace target.
Trading involves substantial risk and is not suitable for all investors. Past performance is not indicative of future results.