
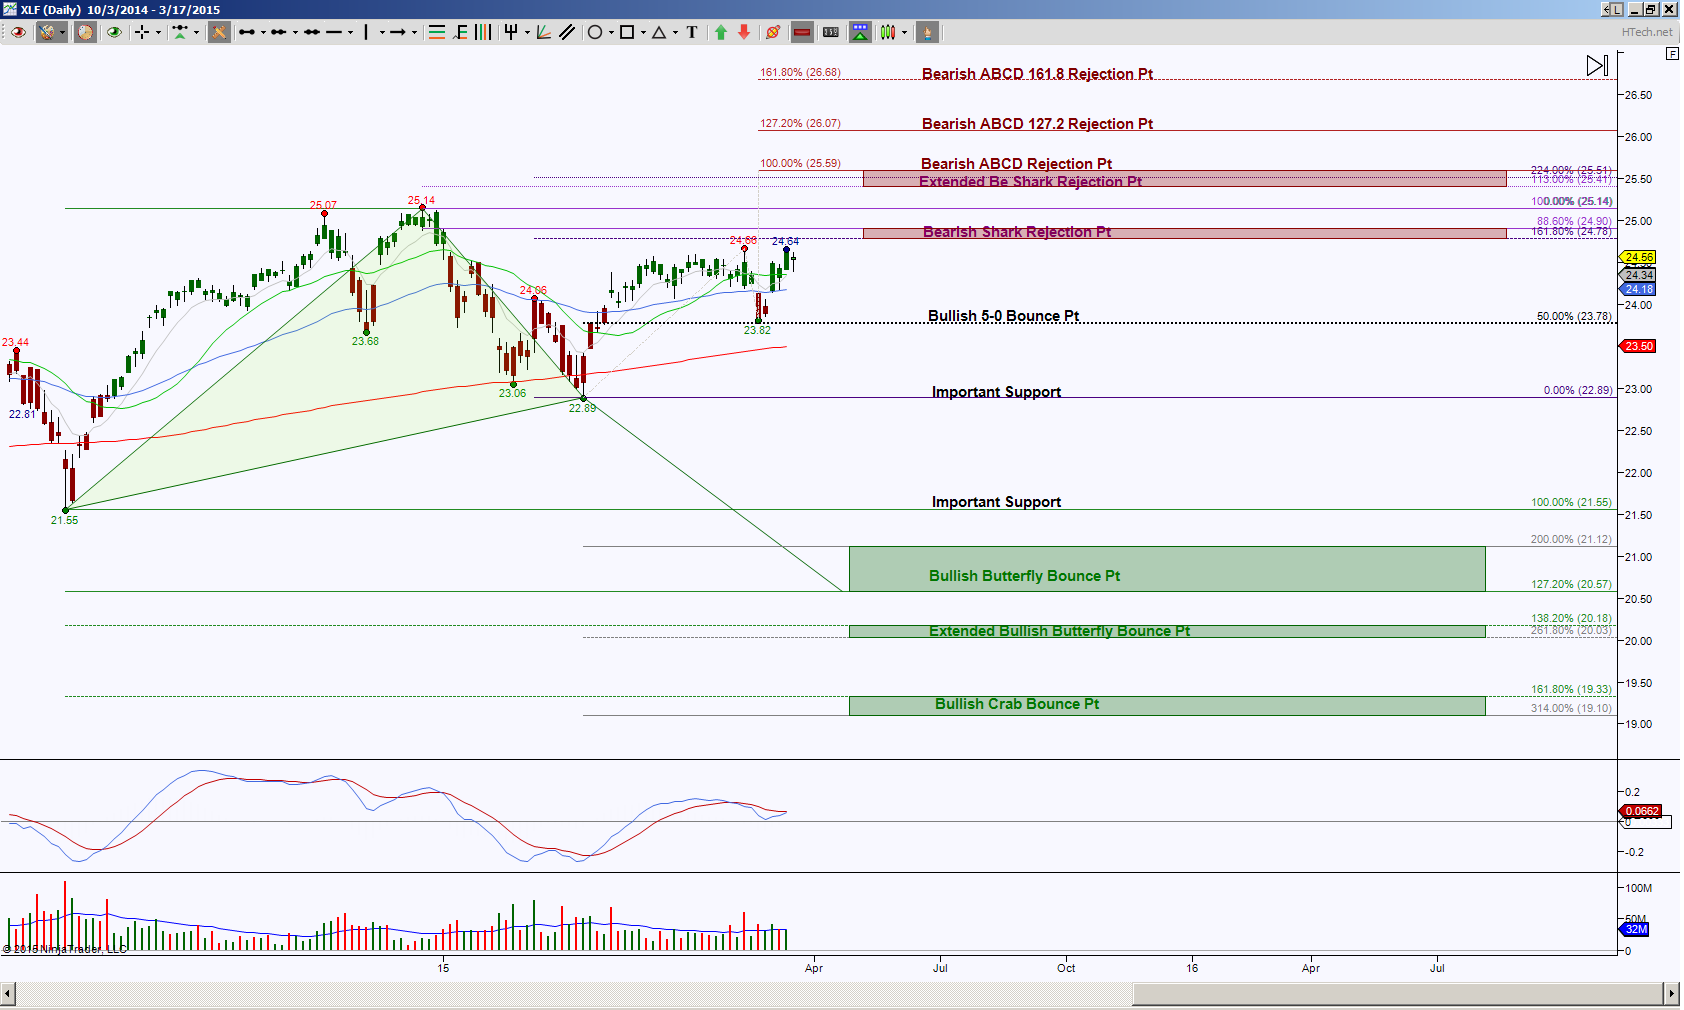
Are the bears, bulls or sharks cashing in on the XLF price movement? The Day chart shows price is in a sideways range showing the current bias with neutral to a slight upside preference. I’d like to see either a hold initially above 24.90, then more important above 25.14 for upside bias toward the Shark PRZ or ABCD harmonic pattern targets OR a hold below 23.78 then more important below 22.89 for a downside bias to harmonic pattern targets as shown in the green colored PRZ’s. PRZ is an abbreviation for Potential Reversal Zone aka the completion target for a harmonic pattern.
Currently price is pushing into an initial bearish PRZ between 24.78 and 24.90, called a Shark. This particular pattern likes to retrace either 50% or 100%, notice how the 50% target helps test the bottom of the current range or ideal initial break down level. There’s minimal oomph with this current push into the Shark, so unless there’s some evidence of increased momentum, the probability is price will hold inside the range.
Below is the weekly perspective on the left side and the intraday perspective, in this case I’m using an hour chart, on the right side.
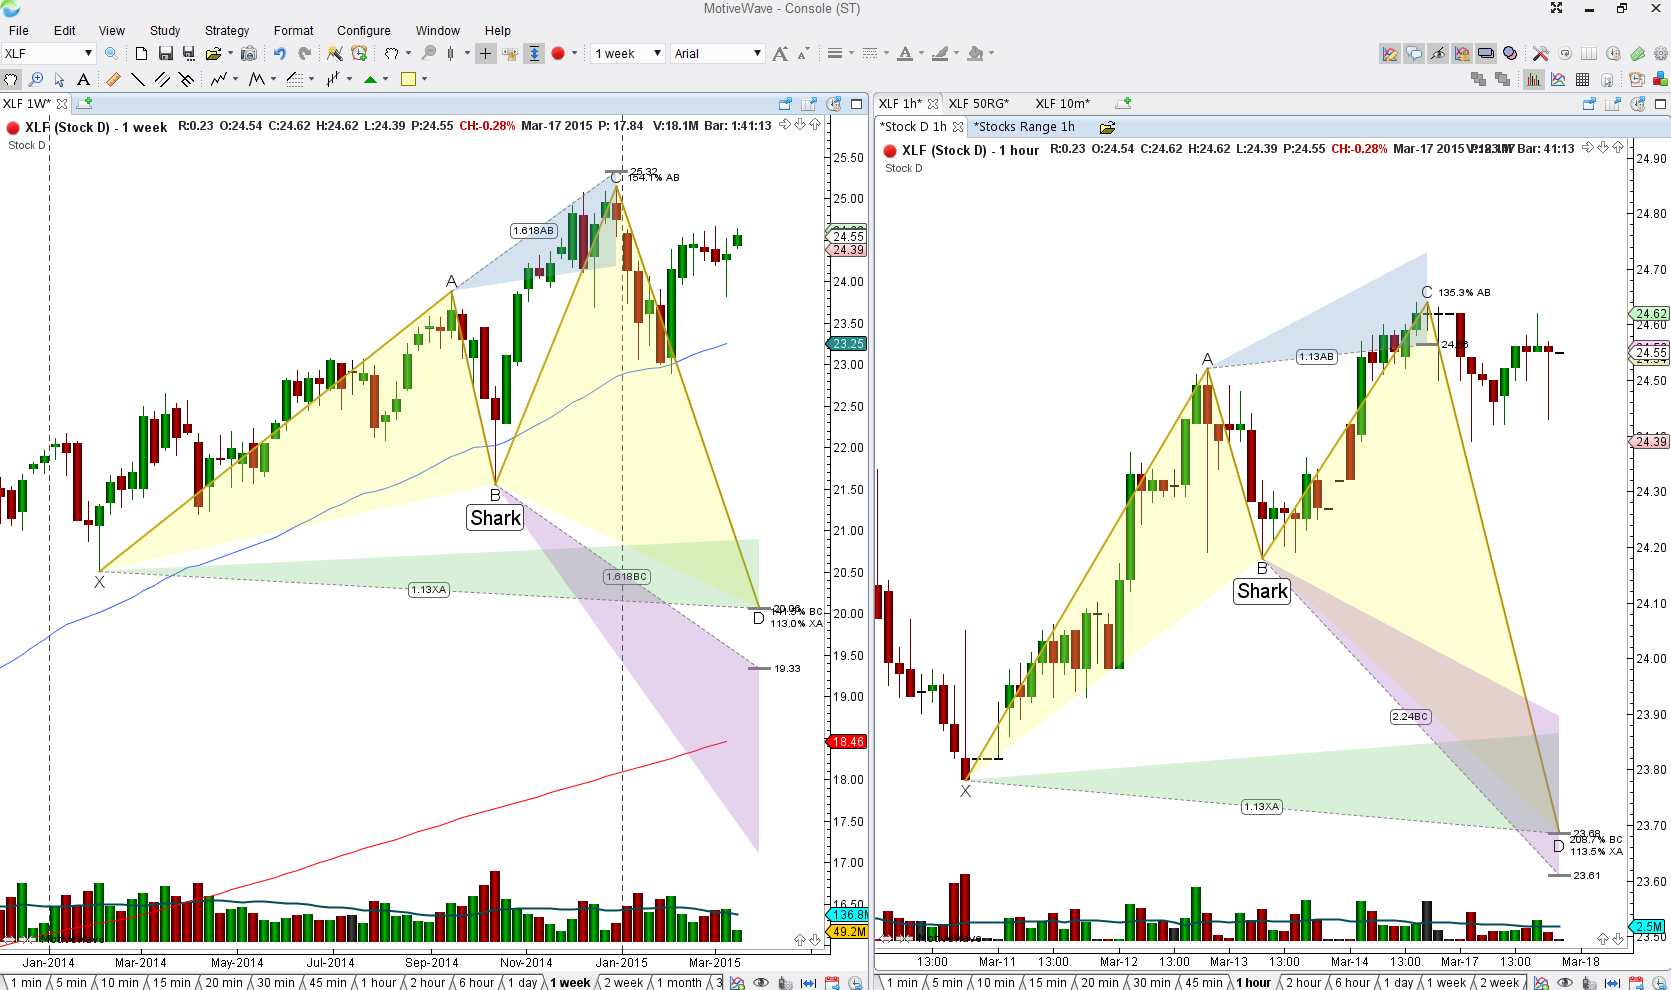
I find it quite interesting that both the bigger and smaller perspective have an emerging Shark pattern which is opposite of the daily Shark’s pattern. Sharks are swimming in the financial sector and right now all three timeframes are at a stall or decision point. If momentum precedes price, there’s a lack of it so be cautious of false breakouts, after all, I don’t deny the wicked wicks on these most recent bars in both the larger and smaller view.
Keep in mind that there’s still a bit of a lee way to the upside for both of these Sharks to remain valid, but unless price can begin the descent with some wind behind it, the day chart’s opposing Shark could reign. I’ve said it often, I’m always in awe of how harmonics interact with each other, harmonics are fractals, and the completion of the Monthly Shark at the 20 area has convergence with the Day Butterfly completion zone. And should the month chart’s price breach the current high to test the extreme of it’s leg at 25.32. this has convergence with the Day’s double PRZ (this is where two harmonic patterns merge into one zone, this one being a Shark and ABCD) at 24.78 to 24.90.
Trading involves substantial risk and is not suitable for all investors. Past performance is not indicative of future results.