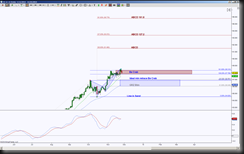
US Dollar day chart shows price has completed a bearish Crab and is currently stalling inside this PRZ (aka Potential Reversal Zone). The initial levels to break and hold are either above the PRZ or below it, those levels at 88.319 or 87.766. An upside move has large ABCD targets. A downside move increases the probability of going into retracement mode having the ideal minimum target at 86.991 and ideal target at 84.525.
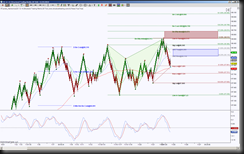
The intraday chart, in this case an STRenko 20 bar, shows what’s happening inside the Day chart’s PRZ. There was a bearish pattern completion at 88.515 as shown in green and called a Bearish Butterfly, this pattern has retraced approximately 50% which is considered a shallow retracement. There is another emerging pattern as shown in brown color coordinated fibs and triangle, which exhibits price is still forming the third triangle point. This point can be here at 87.891 or the next probable point target is at 87.721, we won’t have a valid triangle until price can test 88.116 from where we currently are.
It’ll be important if price bounces into 88.116 but holds below there because it’ll portray two things, one, we have a valid brown triangle and two, price is showing weakness due to a bullish cross invalidation. Both of these scenarios are a sign of downside continuation, remember from the Day chart perspective, that the bottom of the PRZ is a target, and this intraday view enhances that scenario by first rejecting 88.116 and more important holding below each brown fib.
Since this is about half way between the intraday range of 88.515 and 87.230, even though currently the bias is to the downside, it is testing key support so it can easily go either way, the key is to be prepared for more than one directional movement. The bias can shift to upside with a hold above 88.116, implying a retest of the top of the range and or the higher PRZ targets of 88.674, 88.799 and 89.066.


