
Back at October 1, 2015, THEN IYR had completed a bullish pattern, called a Deep Crab, click here for that post. At that time, there was a puny attempt to retrace that bullish pattern. It’s ideal minimum target was 74.11. A good rule of thumb for retracement targets are what I call the Gold Ratio Zone (GRZ), this is the area between 38.2% and 61.8% Fibonacci’s.
NOW, the day chart shows that after the October 1st post, price did push through the 74.11 target but the gray zone reflects my GRZ top at 77.71 and that did hold price from retracing higher. Once price is inside the GRZ, where it breaks out is a directional bias clue, in this case, it hem hawed around but finally had conviction of breaking down the GRZ 74.11.
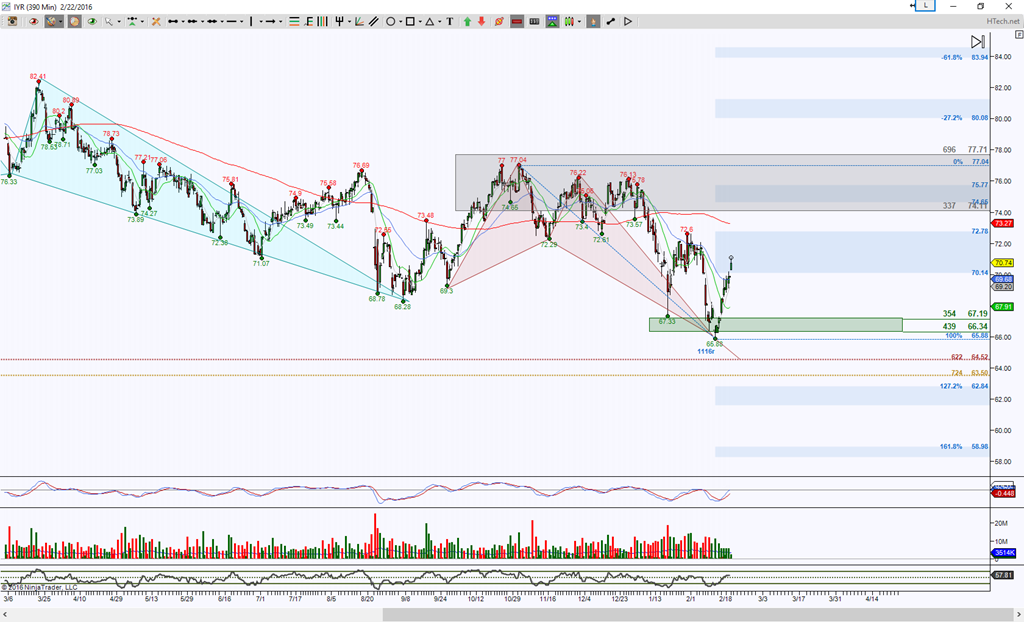
Currently price is in a retracement mode of smaller brown colored Butterfly & note that it is inside its GRZ retracement targets 70.14 and 72.78. Again, watch for price to break and hold beyond this GRZ for directional clues. A hold above 72.78 increases probability of testing 77.04 with scaling points at the blue colored levels. A rejection of 72.29 or more important hold below 70.14 has an ideal downside target at a zone that comprises of two separate harmonic pattern completion points, when this occurs it’s called a double bullish PRZ (Potential Reversal Zone aka a harmonic pattern completion target zone) between 64.52 and 63.50. This double PRZ scenario behaves both as a magnet as well as a probable bounce point.
But first things first, which GRZ level can price take out with conviction.
Trading involves substantial risk and is not suitable for all investors. Past performance is not indicative of future results.