
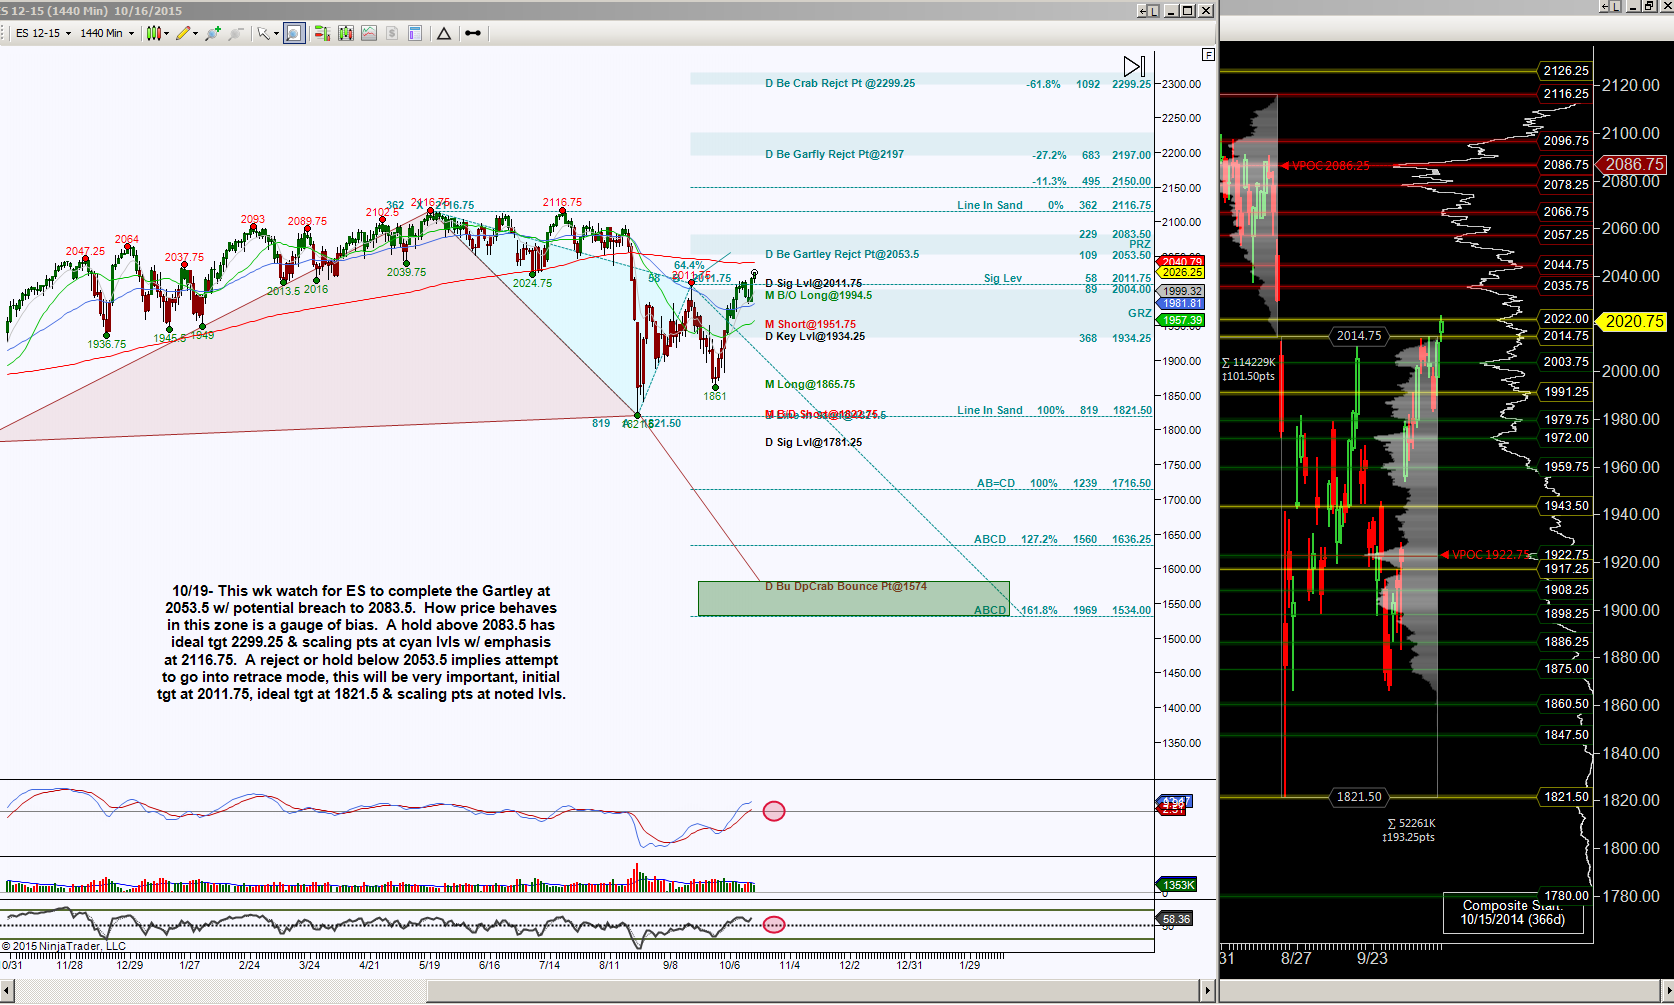
 ESZ15 Day chart shows price is pushing above what I call a Significant Level, this being the initial decisive point, in an attempt to complete a harmonic pattern called a Bearish Gartley at 2053.50. That will be a second decisive point as either a rejection area offering the bears an opportunity to step in and seek retracement targets aka a downside move, or if the bulls can keep the upper hand, that 2053.50 is considered a scaling point in route to higher harmonic rotational targets, the ideal target at 2299.25. Of course there are obstacles to contend with, namely the double top at 2116.75 and a popular extension target at 2197. There is commentary on the chart because sometimes it’s easier to compare the analysis levels with the prices on the chart.
To the right of the harmonic rotation chart is my composite, this offers a visual of the volume at price levels. The simple interpretation being price is at a decisive point. Both harmonics and volume profile expressing price is at a region to make a decision.
I have two yellow bands I call neutral zones and since I couldn’t decide which one I liked better, I kept both levels of 2022 and 2014.75. I find it interesting that Friday, October 16 day bar tried to breach both levels but held inside the bands. If price can hold above the 2022, the probability increases to seek the red bands with 2086.25 as the primary magnet, note it does correlate with the top of the Gartley zone at 2083.50.
Should price hold below the lower neutral zone of 2014.75, there are magnet targets, not as impressive as that 2086.25, but none the less they are magnets, at 2003.75 and 1972 to start with.
Trading involves substantial risk and is not suitable for all investors. Past performance is not indicative of future results.