
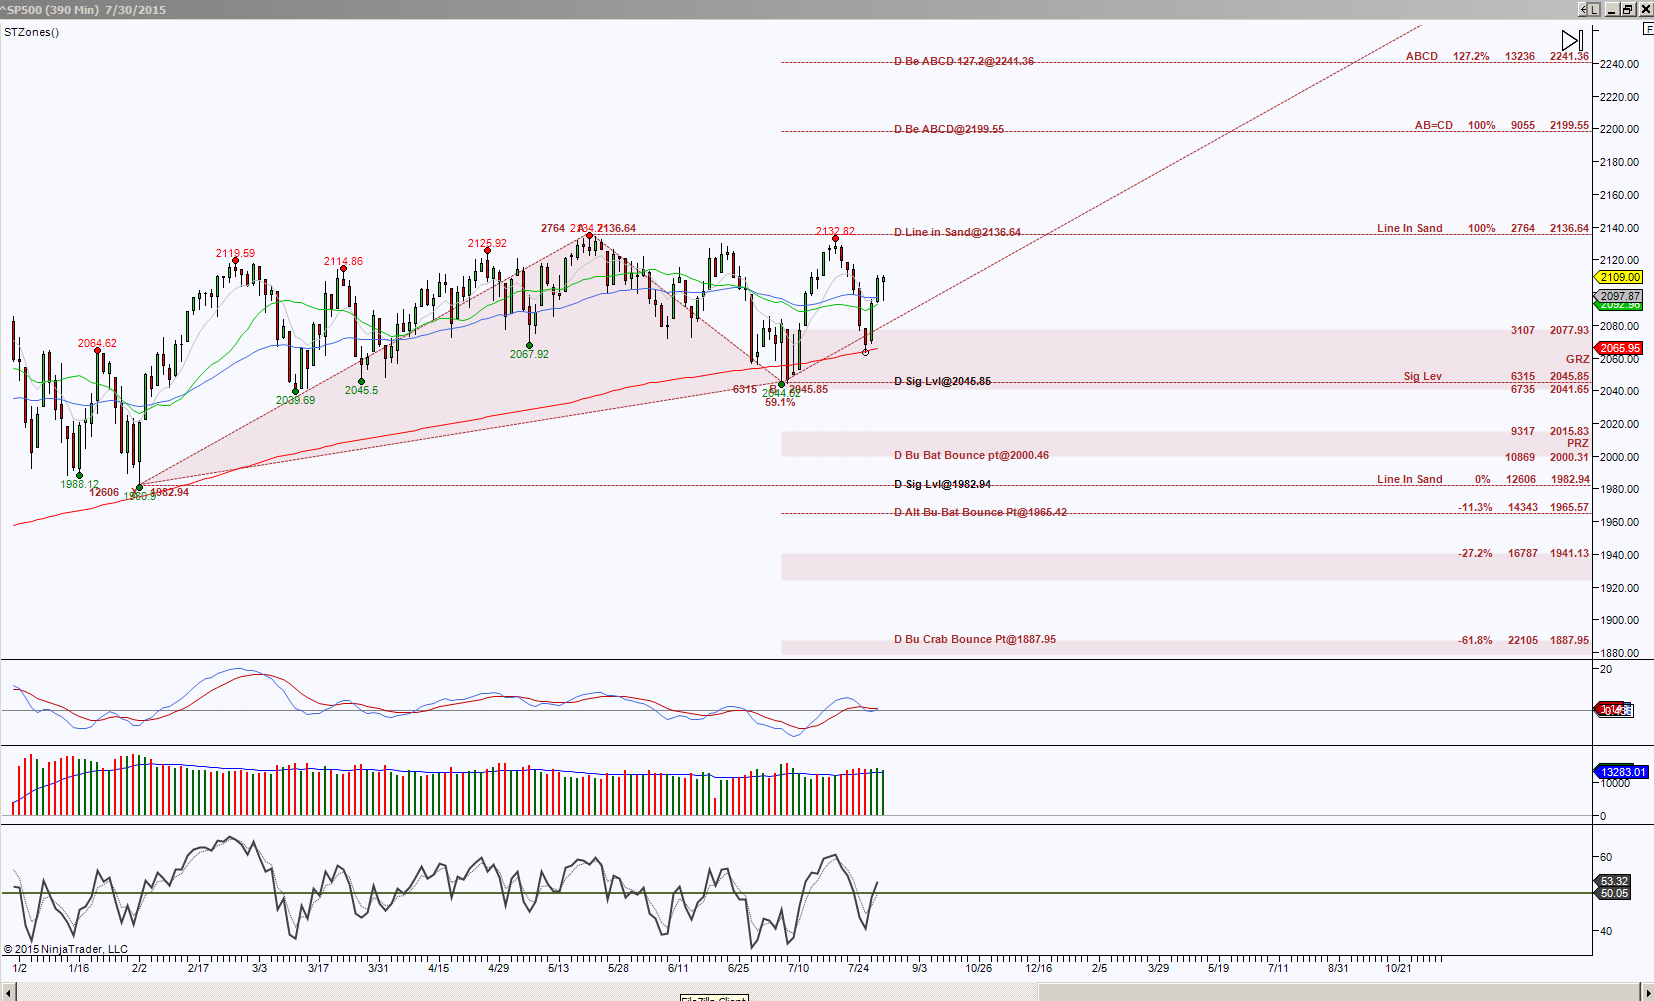
S&P500 Day chart shows price is snipping away between range bound levels. Ideally the bulls would love to see price hold above 2136.64 to increase the probability of upside continuation to ABCD targets. ABCD patterns are harmonic rotations derived from measured moves and Fibonacci extensions. While the bears are seeking price to hold below 2045.85 to head south for harmonic pattern targets as noted in brown colored labels.
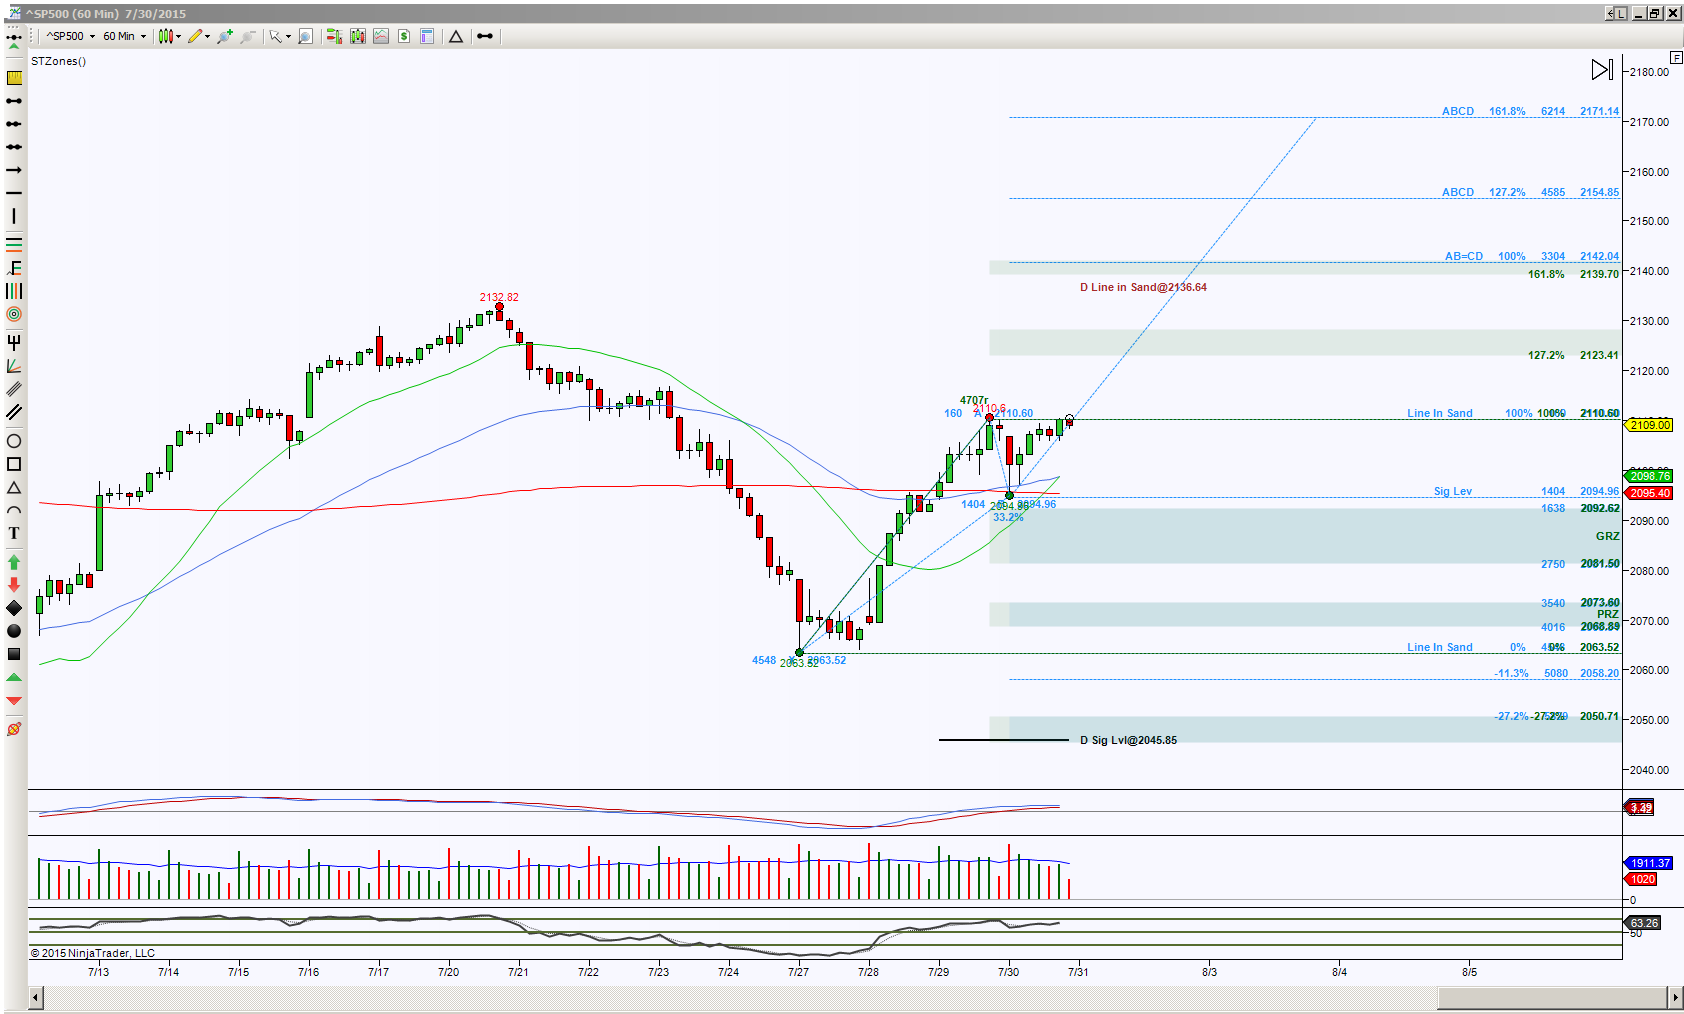
The intraday perspective, in this case I’m using an hour chart, shows nearby Day chart levels for correlation and how the intraday levels can help test them.
Currently price is testing a swing point region of 2110.6, lacking oomph but still knocking on the door. A hold above here increases the probability of testing the light blue ABCD target at 2142.04, note this will help price test that Day level of 2136.64.
A hold below 2110.60 has a short trip to the initial key support test at 2098.76 to 9094.96, this will be an intraday do or die region to keep this chart’s upside bias in tact. A breakdown of 2094.96 has the ideal harmonic target of 2058.20 and scaling points at the colored zone levels. But Fibonacci extensions have a reputation of loving to be tested, and there’s the bottom of an extension zone that is convergent with the Day Significant Level 2045.85.
So the intraday rotations in either direction have an opportunity to help those Day chart levels be tested. Momentum and conviction are key components to believing the force of taking out important levels, that I like to call “Line in Sand” or “Sig Level”.
Trading involves substantial risk and is not suitable for all investors. Past performance is not indicative of future results.