
Just a play on words in regards to the financial ETF, XLF and the Transportation ETF, IYT. Both of these instruments are in a consolidation mode while in an emerging harmonic pattern.
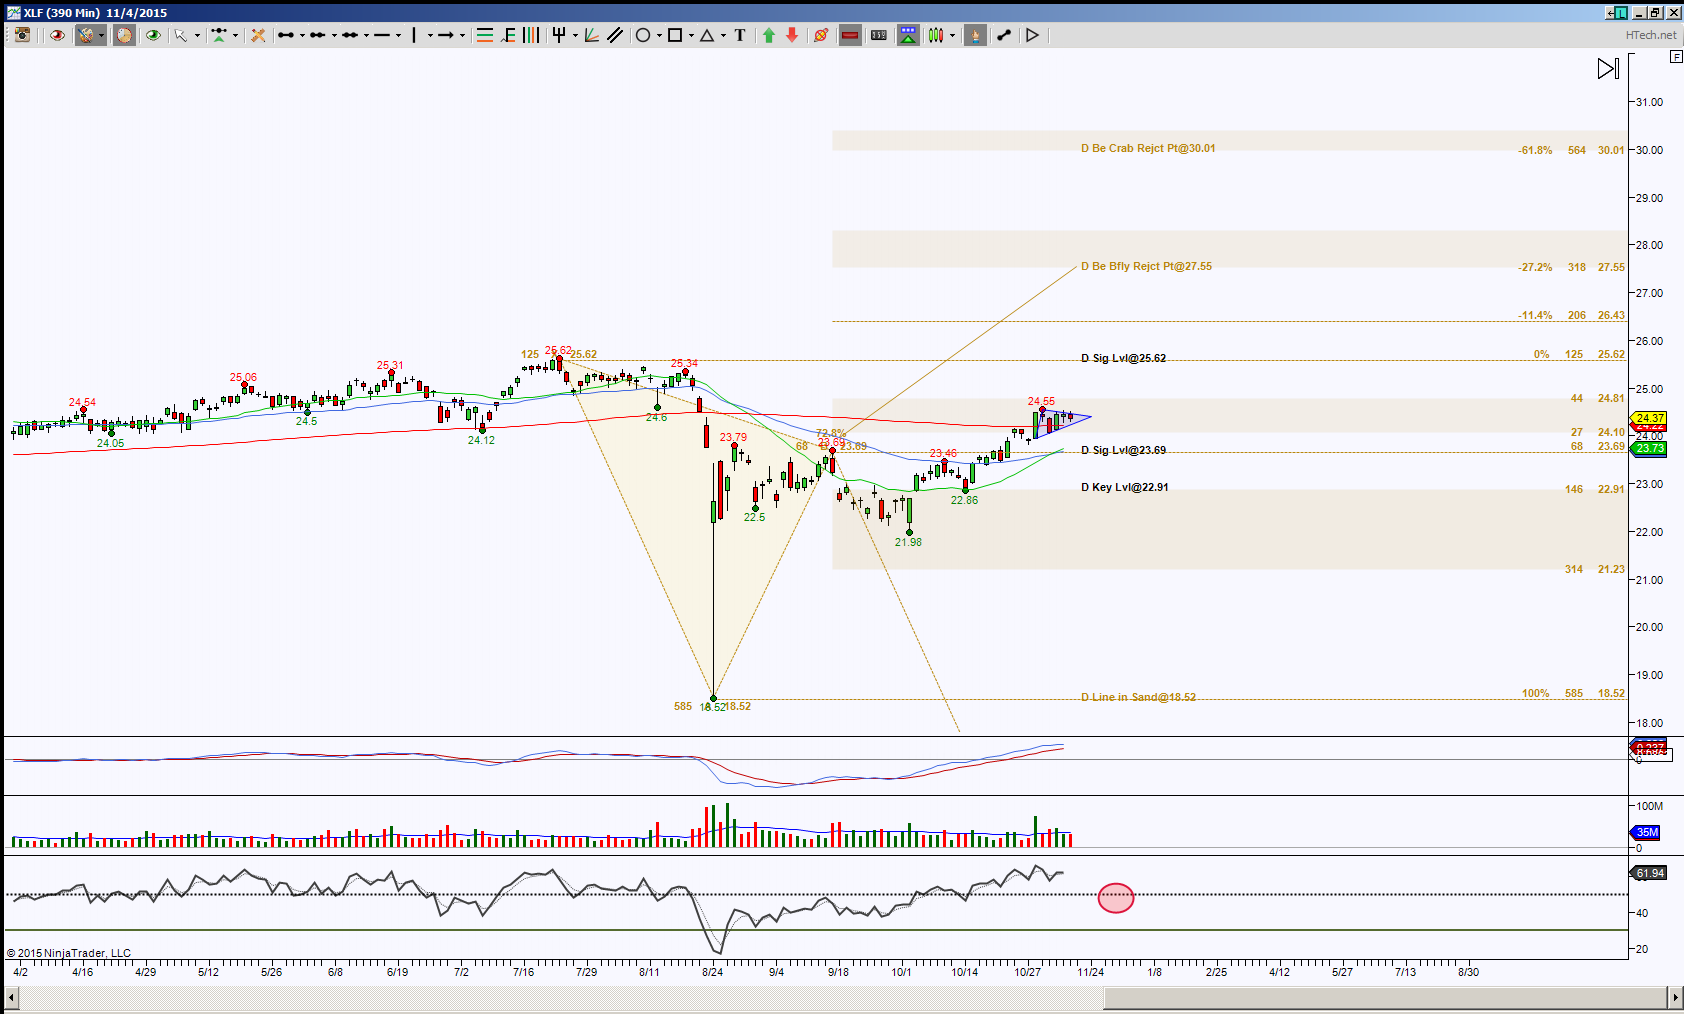
Let’s look at XLF first, this Day chart shows price pushed above an important harmonic level of 23.69 which increased the probability of playing out an emerging harmonic pattern called Bearish Butterfly but alas there’s a zone between 24.10 and 24.81 that price decided to take a breather, or for a better analogy, hold its breath. This is evident by the blue triangular formation inside this yellow zone. This tells us to watch for initially a break and hold beyond the triangle, then more important beyond this yellow zone. As long as price holds above 23.69, the bias is to the upside, but back below 23.69 implies a retest of 22.91 or lower.
Above 24.81 has the ideal target of 27.55 and scaling points along the way at 25.62 and 26.43, these are considered scaling points because they have the ability to create a rejection. Harmonic patterns dream of completion but there are times that a rerouting is necessary so that either a larger harmonic pattern or simply a different harmonic pattern is in the driver’s seat.
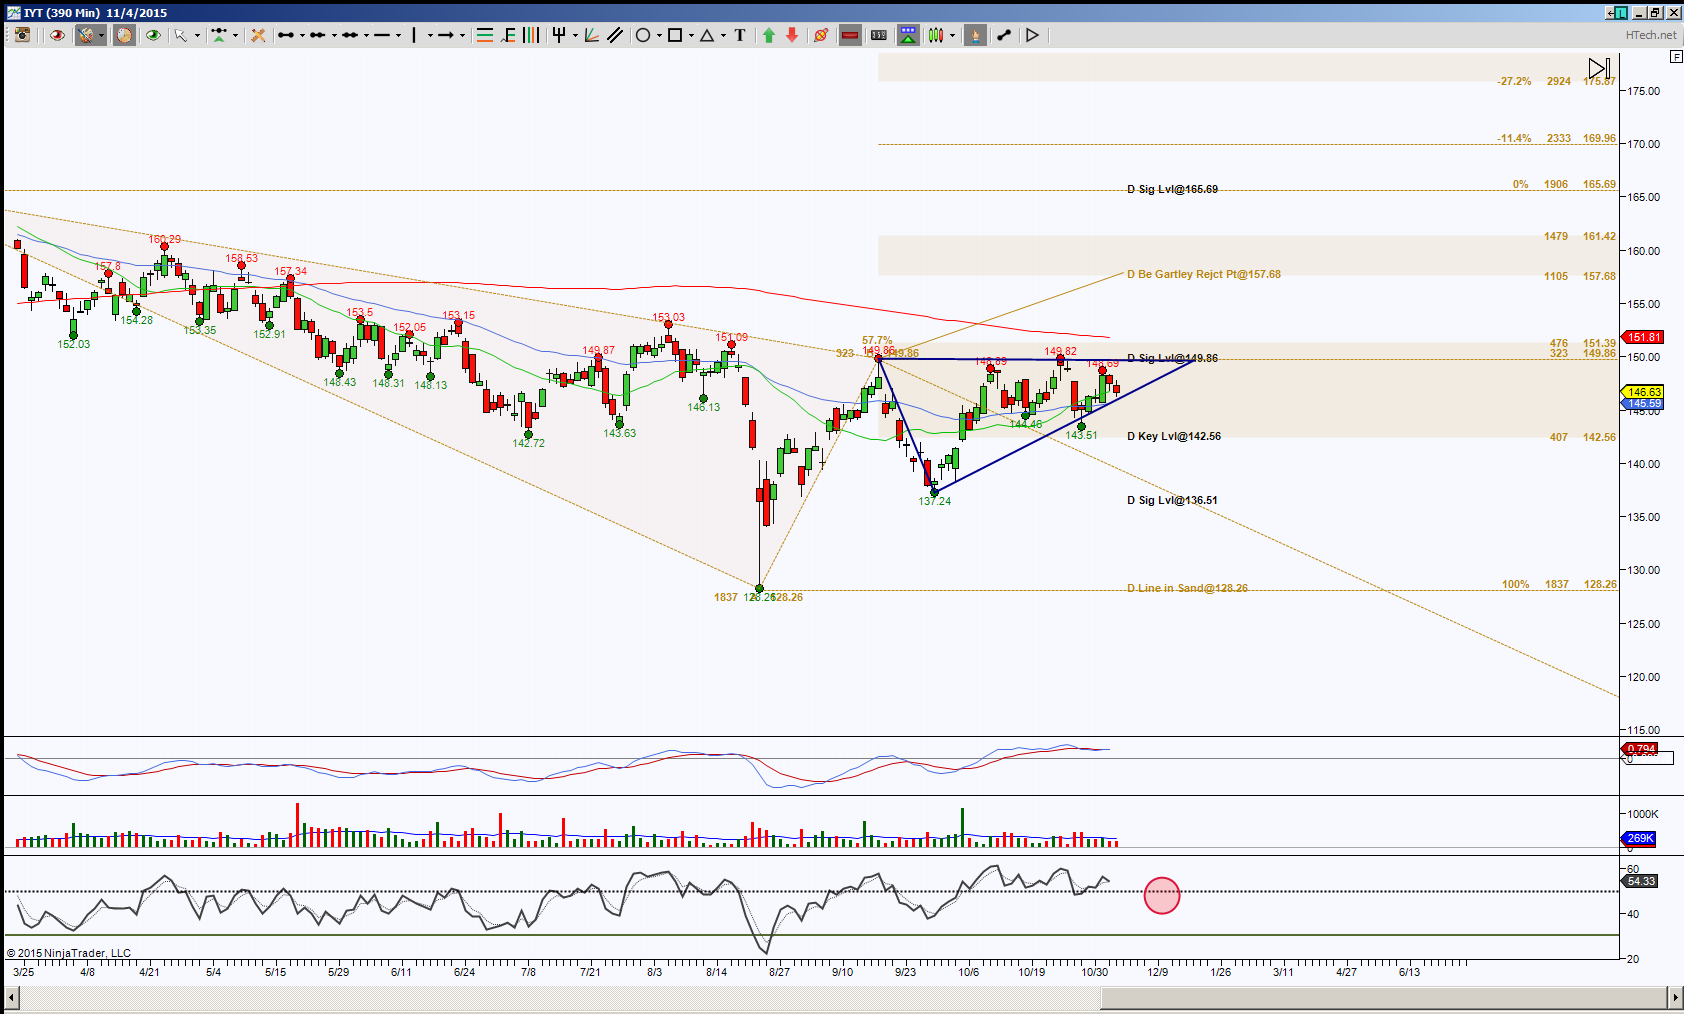 Speaking of drivers, transportation is also in a triangular formation, this one is more likened to an ascending triangle which offers a slight probability of upside movement, let me emphasis slight because any time price is holding its breath in a contraction type scenario, it can literally breakout in either direction. There are some other clues implying upside pull as well, but personally I’d like some conviction with a hold above 149.86 to increase the probability of completing this harmonic pattern called a Bearish Gartley at 157.68.
The great thing about harmonic patterns is they offer targets then once they have completed it tells us to reflect upon the scenario to see if that completion was a place of reversal or merely a means to an end, meaning further targets are to come.
But first things first, this triangle is also contained inside a zone, I call this zone the Golden Ratio Zone which encompasses the area between 38.2% and 61.8% Fibonacci levels. As you can see price is approaching the apex of the triangle so watch for the triangle parameters to break and hold first, then the GRZ aka above 151.39 or below 142.56. Once this has occurred the noted targets are sought.
Trading involves substantial risk and is not suitable for all investors. Past performance is not indicative of future results.