
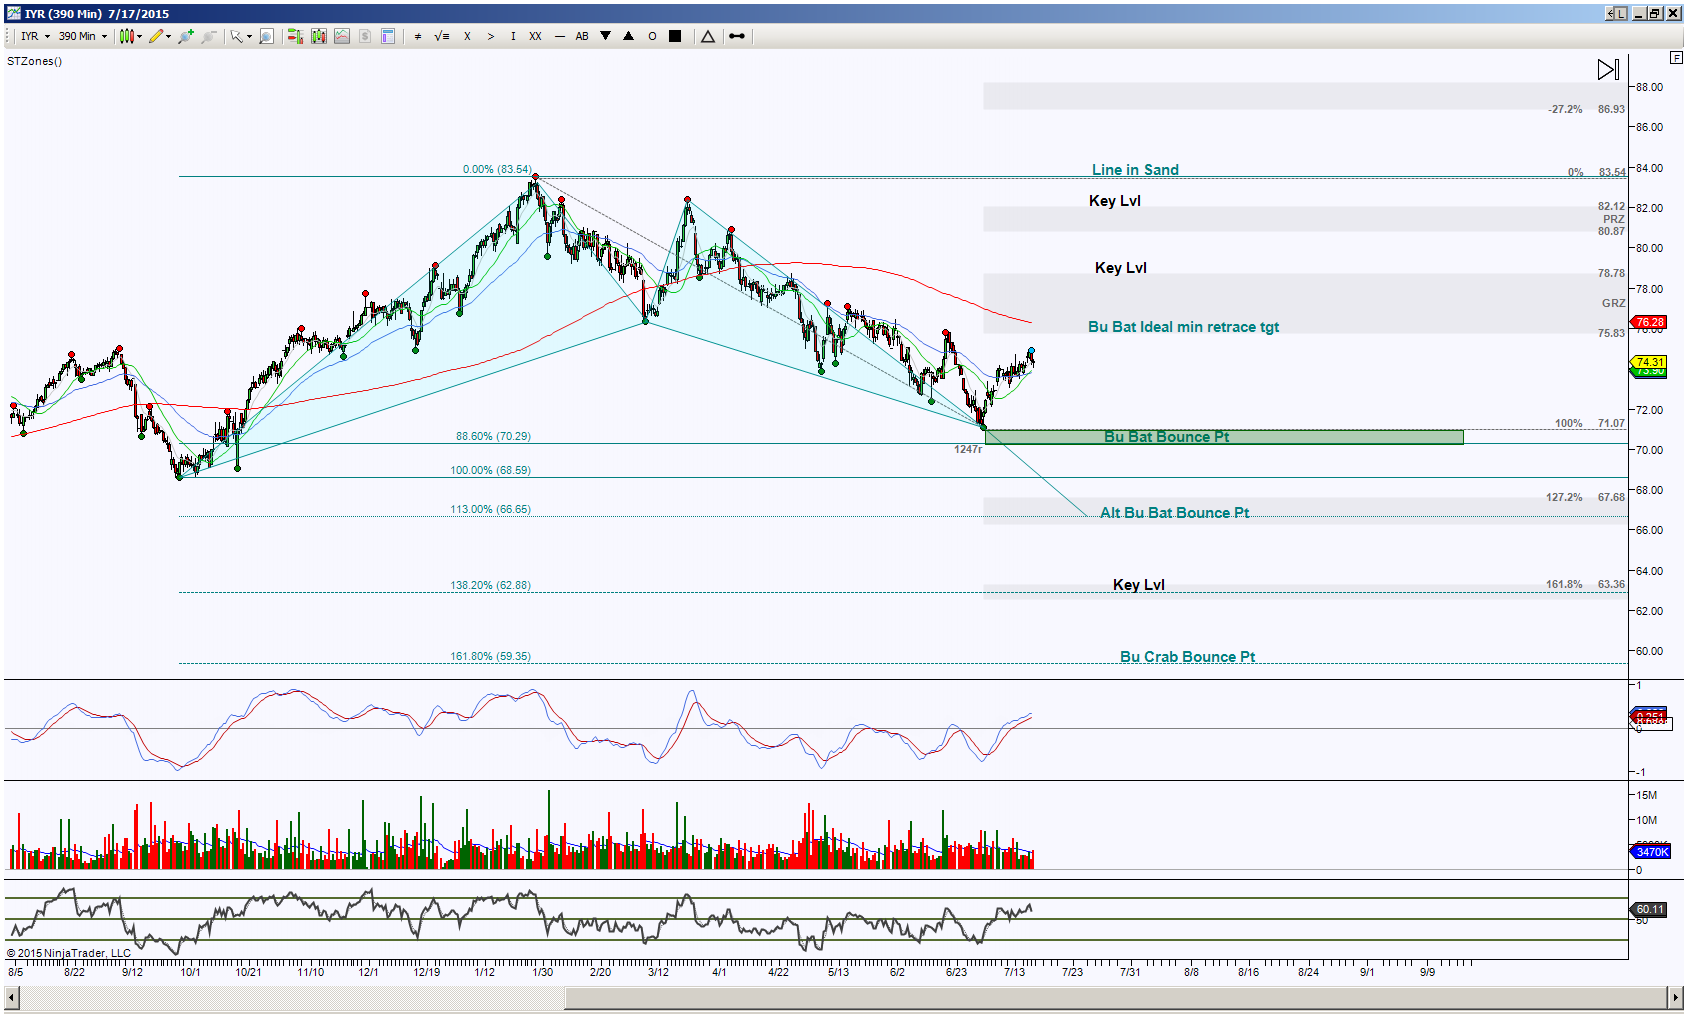
IYR, the real estate sector ETF, is in a bouncing retracement mode after completing a bullish harmonic pattern. The Day chart shows the ideal minimum retracement target is 75.83 and the ideal target is 83.54 with scaling points or points of interest at 78.78 and 82.12.
The bias has shifted to upside during this retrace mode and will increase in that scenario with a hold above 75.83, and at this juncture has the aforementioned upside targets. Failure to push and hold above 75.83 suggests weakness in the pattern’s reversal strategy, this means the probability is high to returning to the PRZ (Potential Reversal Zone aka the completion zone of a harmonic pattern). A second test of the PRZ implies a test of 70.29 or potential breach to 68.59, but failure to have a respectable retracement bounce from there increases the probability of downside bias with the targets at the lower harmonic PRZ’s at 66.65 and ideally 59.35.
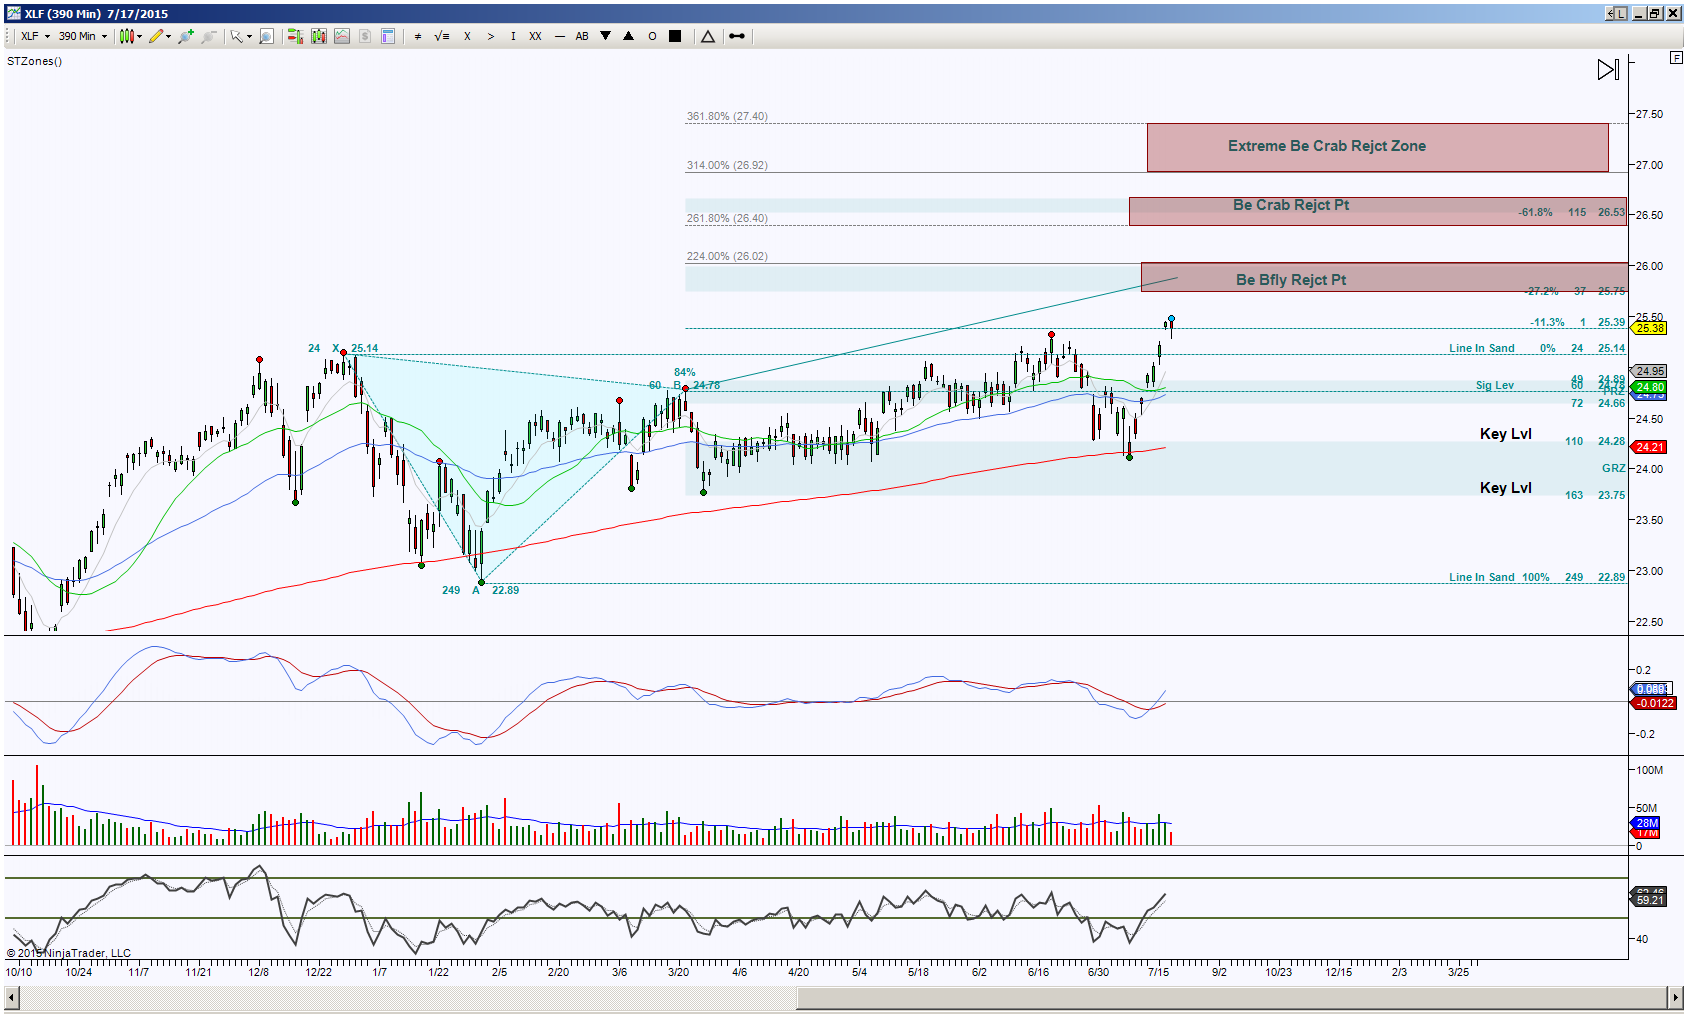
The Day chart of XLF, the financial sector ETF, is in extension mode of a nicely held upside bias. This implies a stall or pull back to perhaps 25.14 for starters, or to a more important support test of 24.78, prior to completing the emerging pattern. This is a potential three tier pattern so each red zone is not only an upside target, but also a probable rejection point. Keep in mind when price is inside the PRZ, where it exits and holds offers the probability of which noted targets are in play.
I had mentioned the important support level at 24.78, below there risks shifting the bias from up to down and has the noted Key levels 24.28 and 23.75 and Line in Sand level 22.89 as the downside targets. As long as price can hold above the initial pull back targets, the bias remains to the upside.
Trading involves substantial risk and is not suitable for all investors. Past performance is not indicative of future results.