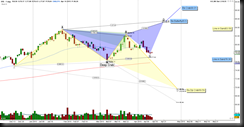
The ETF for US Real Estate, IYR is in between opposing emerging harmonic patterns. There are distinct levels that can invalidate one of the patterns, one being at 83.56 and the other at 76.36. A break and hold of one of these levels offers increased probability of testing either 85.5 to 88.01 above or 69.59 below.
The Day chart shows a neutral to slight downside bias, how price behaves at the test of 76.36 will offer a higher probability in that if it holds above it with conviction, then a retest of 82.41 is what I’m looking for. Upside continuation has the ideal target of 85.5 or 88.01 with an important line in sand level at 83.56. A line in the sand level in the world of harmonics is the level that can eliminate a pattern, in this case the yellow colored emerging Deep Crab, and a hold above there, like I said, will increase the probability of completing the blue colored pattern.
I’d like to see some oomph to take out the lower line in the sand level 76.36, below this level will invalidate the blue colored pattern and focus on completing the yellow one. However, price needs that conviction to hold below 76.36 to increase the probability of testing 69.59.
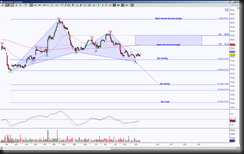
So, this chart shows price is approaching a do or die level. I like to look at a zoomed in view for clues as to how price is behaving as it approaches important levels, in this case I’m using an hour chart.
This chart shows price has completed a pattern, a bullish pattern at 77.63. This suggests at least an attempt to go into retracement mode, in this case that would be a bounce having ideal targets at 79.33 and 82.41. Here’s the thing, a rejection of 79.33 OR failure to get there suggests downside continuation, with the ideal target at 72.57 and scaling points at 76.33 and 74.68. Now, that offers us convergence with the Day chart levels. A test of 76.33 is that line in the sand region, a completion target of 72.57 helps price hone in on that Day target of 69.59. Back to the Hour chart, this one does have distinct downside bias so a puny, or as I call it, an embarrassing retracement aka a shallow bounce, strongly increases the probability of downside continuation.
A wise trader will have a directional bias when entering a trade, but ALSO have a determined region that if price surpasses, will tell the trader the bias is wrong and to re-evaluate. So i like to be prepared for that scenario of being wrong with my initial bias. If that’s the case, my bias risks shifting to the upside with a hold above 78.53, then that probability increases with a hold above 79.33 and I’ll be looking for that ideal retracement target of 82.41 and scaling point at 80.50. If there’s a retest of 82.41, that places price at the retest of the B point for the Day’s blue colored pattern, and in the world of harmonics, that is a critical level because above it strongly increases the probability of completing the pattern at 85.5 or 88.01.
Trading involves substantial risk and is not suitable for all investors. Past performance is not indicative of future results.


