
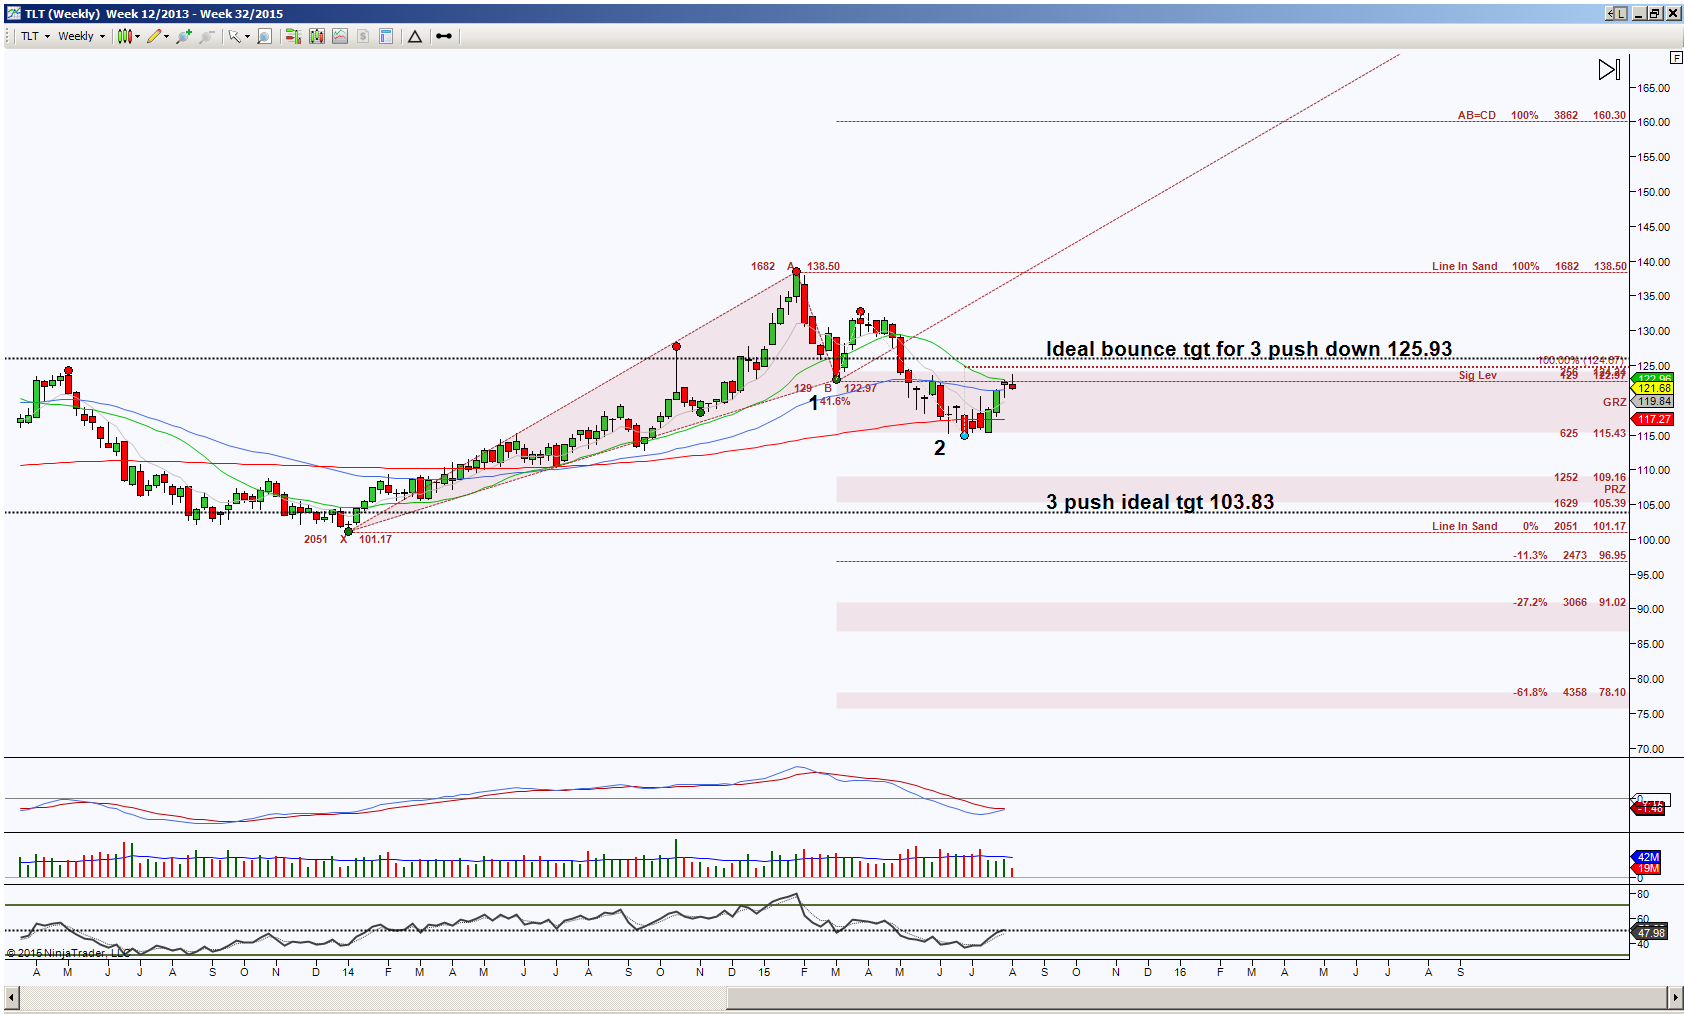
 The ETF for the 20+ year Treasury Bond, symbol TLT, Week chart shows price is attempting to form a downward 3 push pattern. Harmonics and symmetry are bonding in this instrument with an ideal downside target at 103.83 region.
Symmetrically speaking, an ideal bounce target is 125.93, however there is some convergence at 122.97 which is currently attempting to prevent upside continuation at this time. Simply put, the initial important level for price to hold above or below is 122.97. Above it has a target to 125.93 and this will become the more important do or die level. Below 122.97, even if there’s a breach upward to 125.93, increases the probability of downside bias and has that target of 103.83. Those who utilize momentum will be watching for a hold at their respective midpoint for the short side scenario and a push upward for the long side scenario.
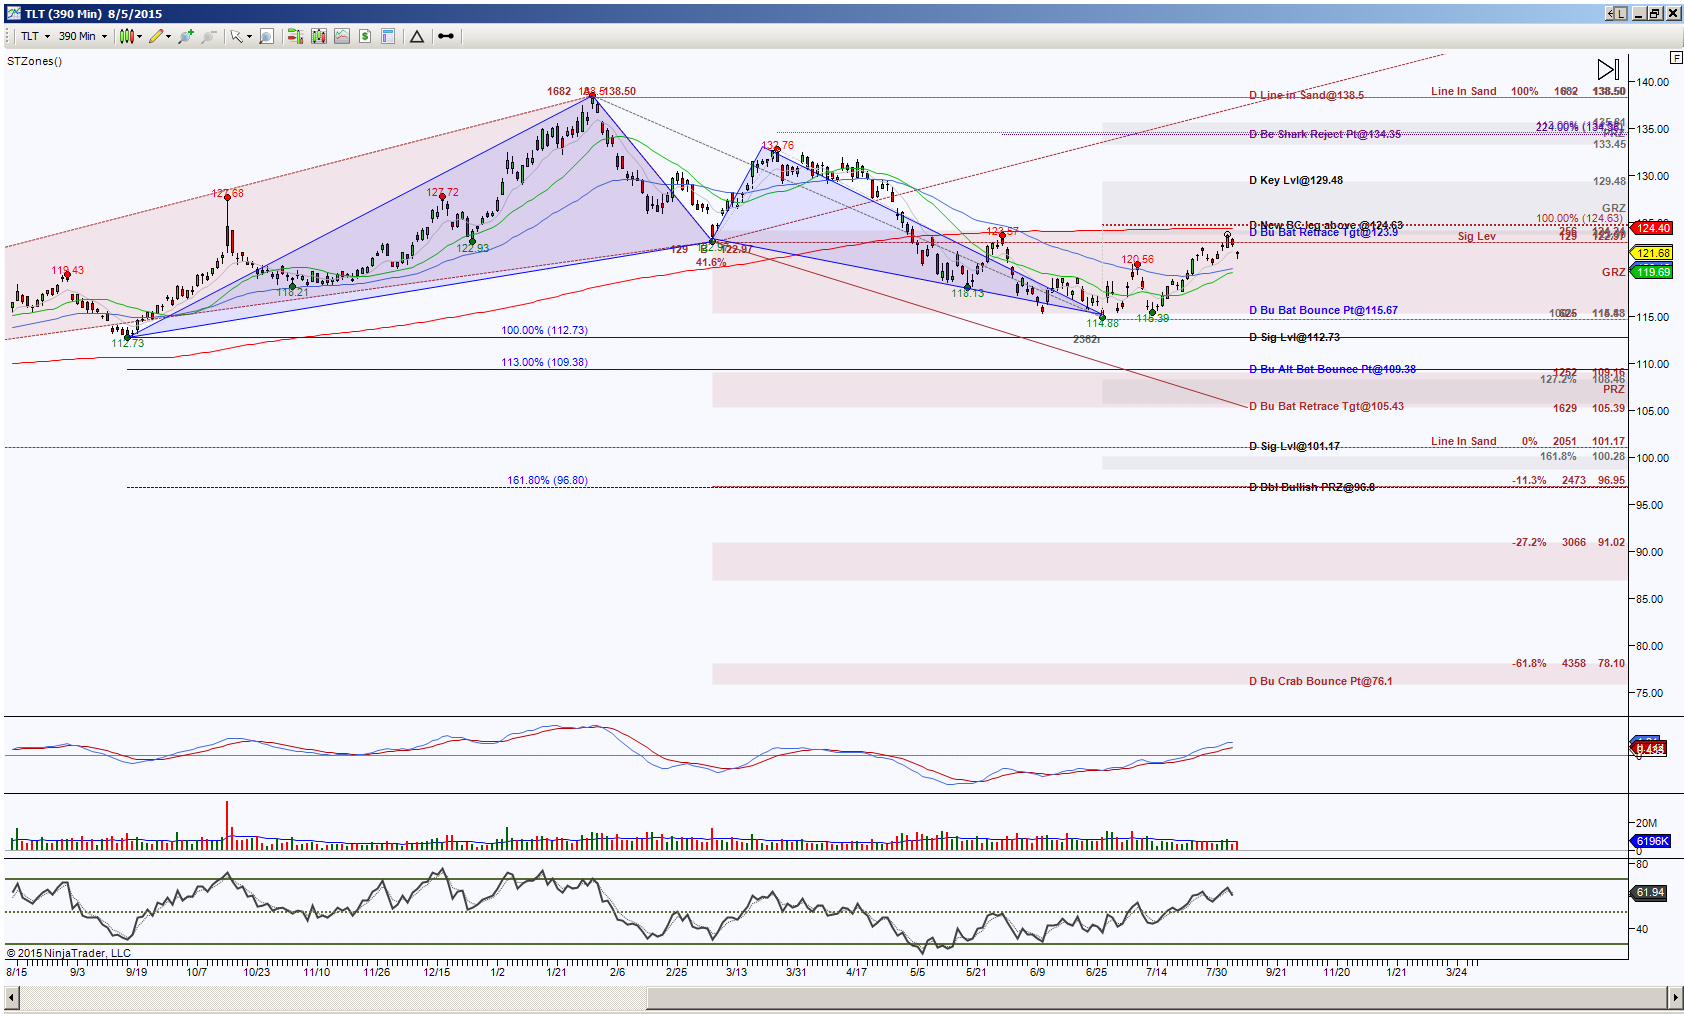 Honing in on the Day chart, there’s a lot of harmonic pattern action. The first being a bullish Bat, blue colored pattern, is in retracement mode, this means the pattern was recognized as valid and carrying out the bullish purpose of the pattern. How much it retraces offers clues as to just how strong that reversal pattern was, currently price is in the vicinity of its ideal minimum target of 123.9, a hold above there does increase the probability of testing upside targets of 129.48, 134.35 and ideally 138.50.
The brown colored emerging pattern is a duo opposing pattern scenario with the do or die levels at either 138.50 or initially 119.69, then more important 112.73. There’s a component of waiting to see if 124.63 is breached to the upside because that would change the dynamics of the brown colored pattern.
Currently TLT is in a decision mode, this chart has currently shifted to an upside bias and is pulling back in an attempt to validate that bias, meaning a hold above 119.69 gets the head shaking yes for the bulls, increasing to bulls cheering with a hold above 124.63. The alternate decision is if price cannot hold above the initial pull back target of 119.69 because that causes an attempt to return to a downside bias with the ideal target at 105.39 and scaling points at the noted blue levels. Note that if this 105.39 target is achieved, this places price in the vicinity of the Week’s chart’s ideal 3 push target of 103.83.
Trading involves substantial risk and is not suitable for all investors. Past performance is not indicative of future results.