Remember all those days that ESH15 was in a sideways range between 2088.75 and 2121, well hopefully you do since it was just last month? This was like the market was holding its breath, which as we all know, can only be done for so long. Beginning last Friday ES let her rip with a strong exhale, followed by a short gasp for more air on Monday, then Tuesday exhaled again.
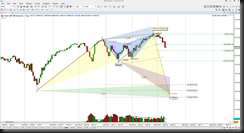
This day chart shows that a harmonic pattern had completed at 2118.50, called a Bearish Butterfly. Those range days were what I call a stall at a PRZ (Potential Reversal Zone aka a completion target of a harmonic pattern). Well this stall was like a deliberation between a Butterfly retracement mode or push higher to seek new value, or in the world of harmonics, a higher harmonic PRZ. And Butterfly retracement mode it is.
There are key pull back or retrace targets that I look for, the first called the GRZ or Golden Ratio Zone, these are the Fibonacci ratio levels between 38.2% and 61.8%, and right now price is smack dab in the middle of this GRZ. This offers key breaking points because now I want to see if price can break either above the GRZ or below it, this will offer probable targets as well as offer clues as to the strength of this Butterfly retracement. I’ve said it many times, harmonic patterns dream of retracing 100% or more, that would take price to 1970.50.
There’s a bigger harmonic scenario in the works, that Butterfly completion point at 2118.5 helped an emerging pattern called a Shark, form it’s 3rd out of 4 legs. Right now price is attempting to play out the final leg, having the completion target at 1837.75 to 1768.25. Yeah, that would be a big “yikes” but first things first, lets see how price breaks and holds beyond the GRZ.
It’s always a good idea to be prepared for all scenarios, because at what point do you admit you’re wrong when price goes against you? I’ve been caught too many times being married to a bias, I learned the hard way to just have a plan if the market doesn’t comply with what I think it should do. So a hold above the GRZ which is the 2062 price, implies a retest of 2117.75, that will be a double top and an important resistance test. I’d want to see some initiative to take that level out to seek higher prices, and there’s a very large ABCD target at 2254.25 with scaling points at 2185.75 and 2225.
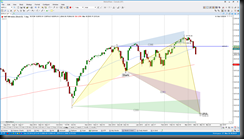
The futures will be rolling soon, so here’s a chart of SPX to keep an eye on those levels as well, same scenario but for simplicity purposes, watch to see where price is in relation to that line in the sand level at 2079.57.
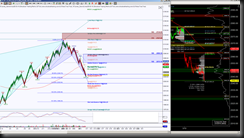
And for Day Traders, here’s an intraday perspective, in this case I’m using an STRenko 20 bar chart.
What’s happening at that mid point of the Daily GRZ? Well, there’s a harmonic pattern completion point at 2045.75, this offers a stall or potential bounce into 2061 or 2070.5, which will be an important resistance test on this chart. Above there implies a retest attempt of 2121 to 2134 PRZ, any upside continuation has an ideal target of 2162 & 2184.75. This will help price reach that first scaling point of 2185.75 on the Day chart.
It’ll be key how much, if any bounce we get from 2045.75, an embarrassing retracement bounce, or failure to get to or exceed 2070.5 has downside continuation pattern targets, the ideal level at 1970.25 and scaling points at 2036.5, 2026, 2005.5 and 1986.25. Keep in mind I consider scaling points as potential rejection or reversal points, so it’s a good idea to take profits at those levels, protect or be ready to exit your position.
Trading involves substantial risk and is not suitable for all investors. Past performance is not indicative of future results.


