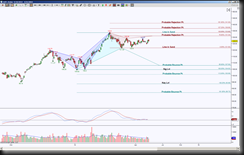
AAPL is in between opposing emerging harmonic patterns, this is indicative of being in a sideways range, I’m referring to this as the core of action.
The Day chart shows this range is between 129.25 and 121.63. You can diddle in the middle, but did you know that the seeds in the core of an apple contain cyanide? Well, we can correlate that to staying in a chop zone, a little won’t kill you, but have you heard about death by a thousand cuts. This is a perfect example of one cut, or stop out of a position, might hurt but it won’t kill you, however, if you have enough cuts, you can bleed to death, or drain your account.
In the world of harmonics, there’s a probability edge, which in reality is all traders have. In this particular instrument, an example of how to trade AAPL is , a hold above 129.25 offers a long opportunity to the initial probable rejection point, this is actually a harmonic completion target, at 131.04. Is this a good risk vs reward for you? If not, wait for the break and hold above 131.04 which offers much higher upside targets. This is just one side of the coin. When price is in consolidation, it can literally break in either direction, keep this in mind so as not to be chained to a position.
The other scenario is a break down of 121.63, this offers a short opportunity to it’s harmonic pattern completion target at 107.93. Then any downside continuation has the ideal target at 86.73 and scaling points at the cyan fibs on the chart.
There would be more reward if price were to break down 121.63, but there’s another spoke in the wheel, there was a completed harmonic pattern at 133.60, this is shown in blue on the chart, and this is a bearish pattern that has been unable to retrace more than 38.2%. That is a sign of strength, so there’s a slight bias for upside continuation but I’d throw that bias out the window for awhile if price is able to hold below 121.63.
Trading involves substantial risk and is not suitable for all investors. Past performance is not indicative of future results.

