
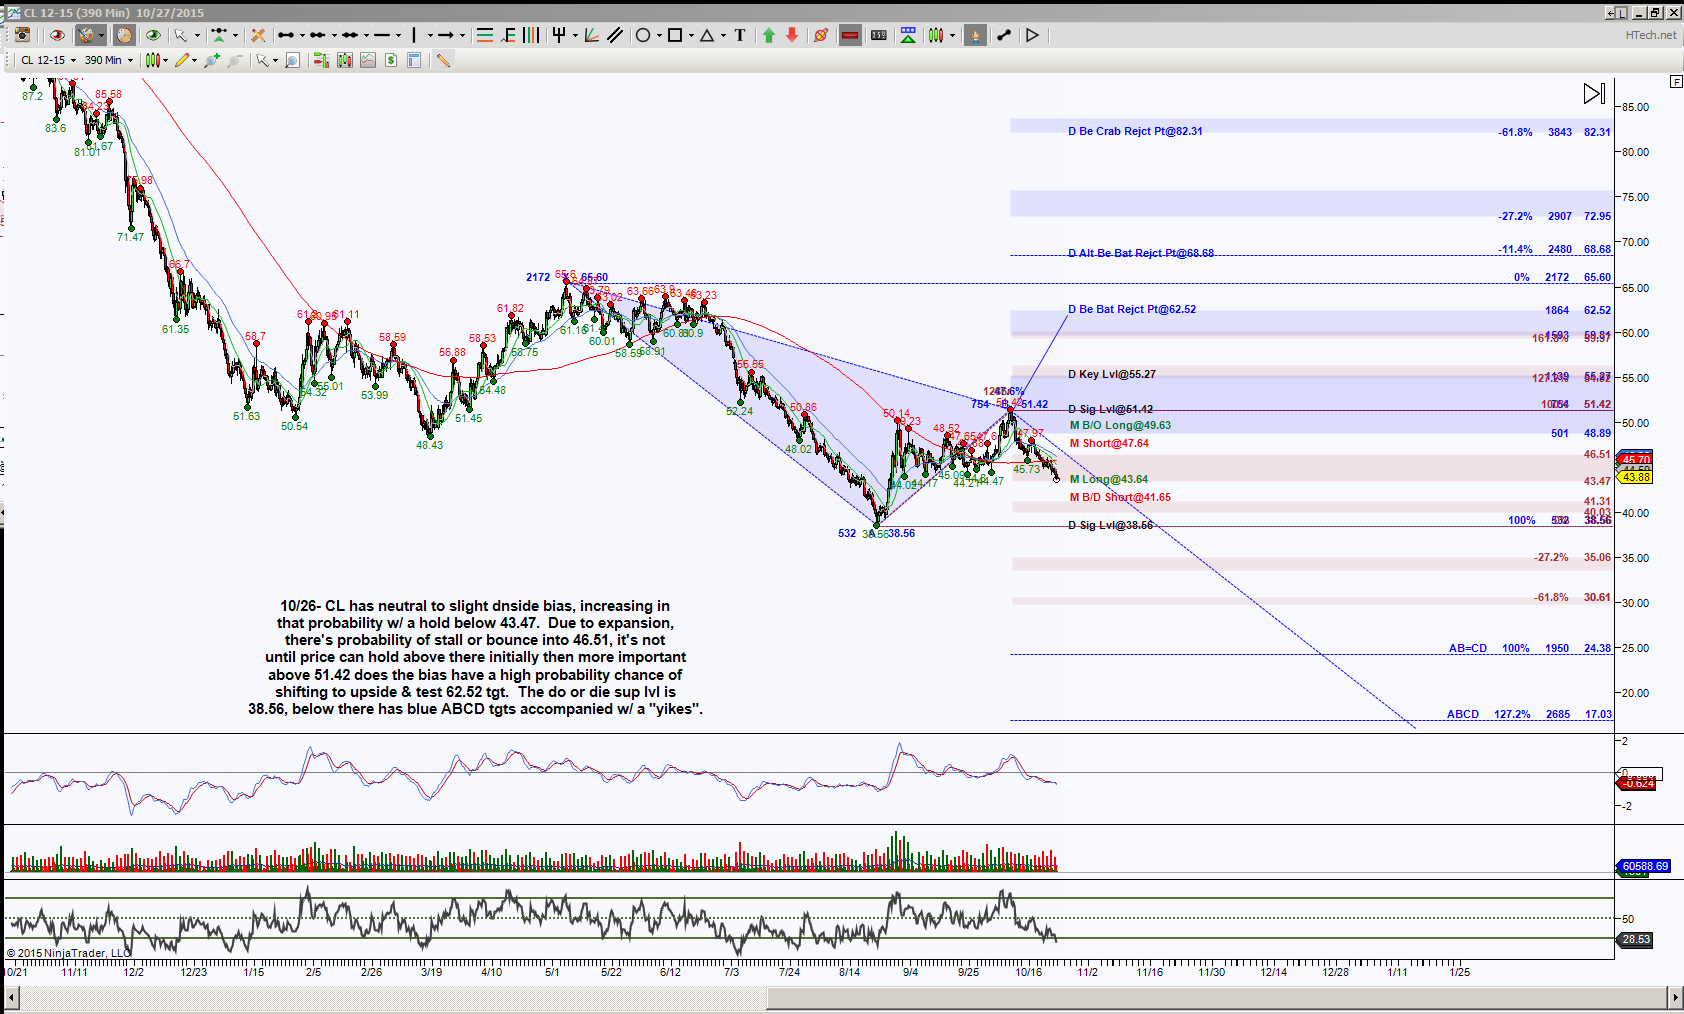
Coming into this week, the Day chart for CLZ15 had neutral to slight downside bias as noted in the comments on the chart. Monday’s action increased the downside bias scenario and is currently testing an important support test at 43.5 region. Due to expansion, there’s implication of stall aka chop or a potential bounce into 45.7 area. Regardless, initial levels to break and hold are above 46.51 or below 43.47, this is a zone I call Golden Ratio Zone. Which direction price can break and hold beyond this zone increases the probability of testing the noted levels.
The blue pattern shows a dual or opposing pattern situation with the line in the sand level at 38.56. As long as price can hold above there, but more important above that 46.51, increases the probability of testing the harmonic pattern, called a Bearish Bat, target of 62.52. As the word “dual” suggests, there’s more than one way to look at these level of 38.56, below it has the noted ABCD target of 24.38. Yeah, that’s a “yikes” situation for oil.
Where does the Butterfly come into this scenario? Well, let’s look at the intraday chart, in this case, I’m using an STRenko 30 tick chart.
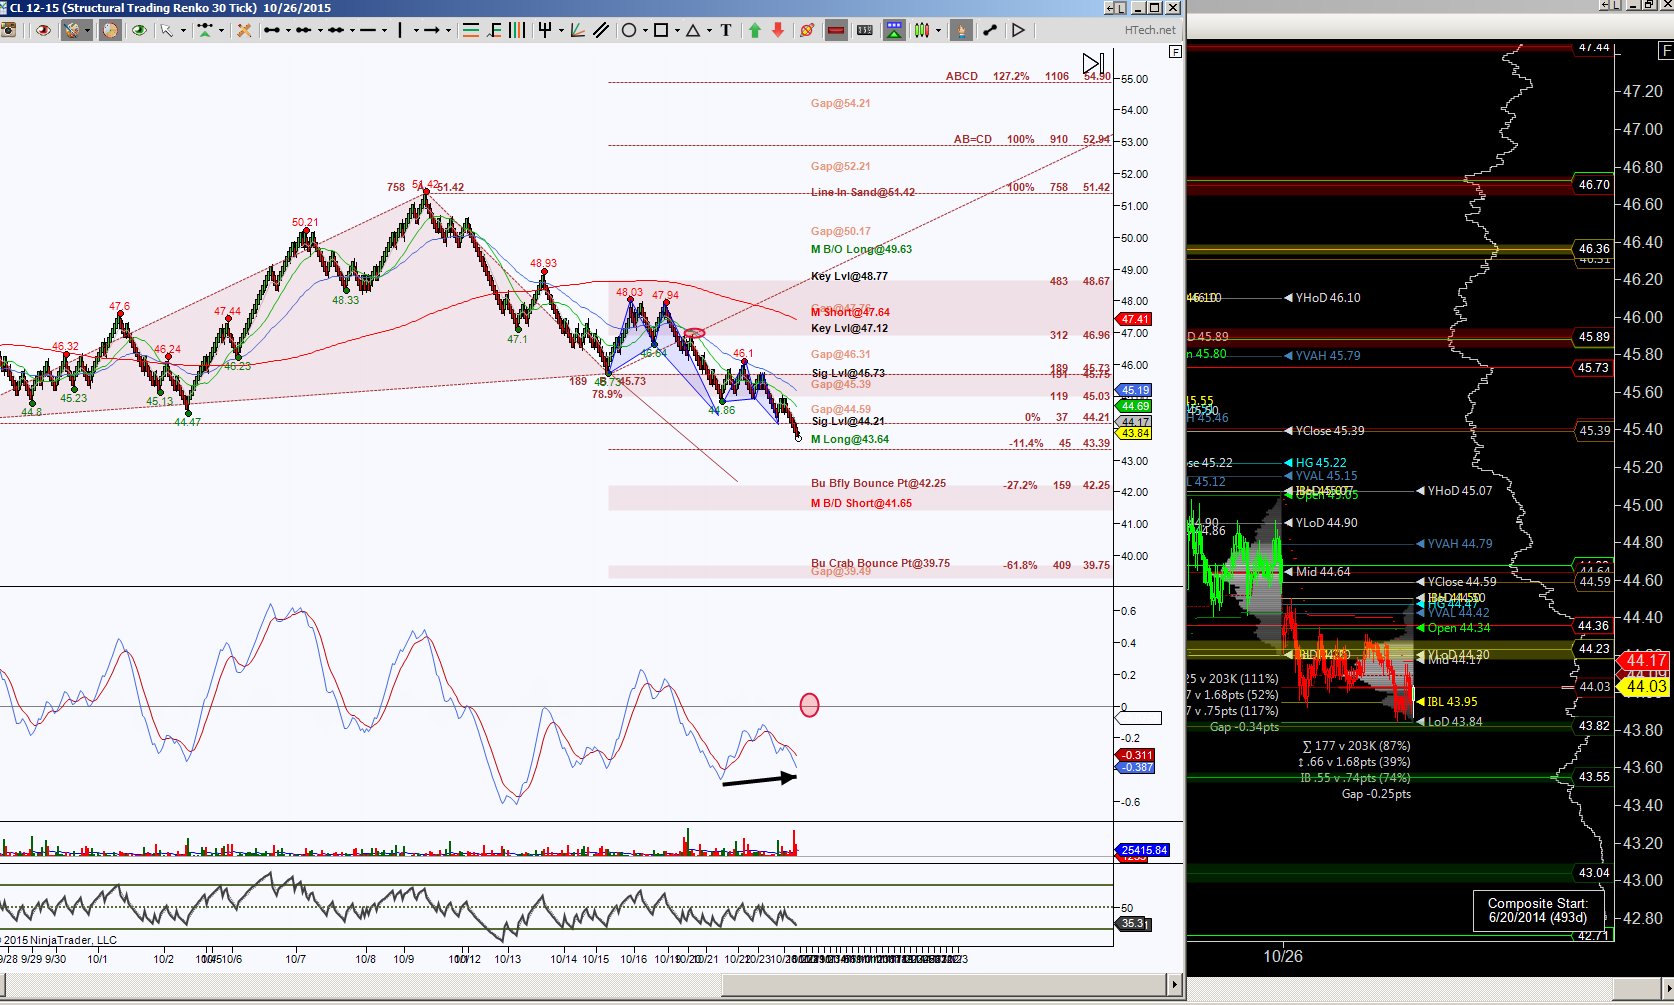
A couple of smaller harmonic patterns, as shown in blue, gave every opportunity for buyers to step in at 44.47 in the world of harmonics, but it appears the Butterfly, being a larger pattern, trumps the smaller ones. Actually those smaller patterns helped price break down 45.73 and reach the 44.47 target, a caterpillar effect, if you will, where price crawls toward the unfolding of a Butterfly.
Trading involves substantial risk and is not suitable for all investors. Past performance is not indicative of future results.