
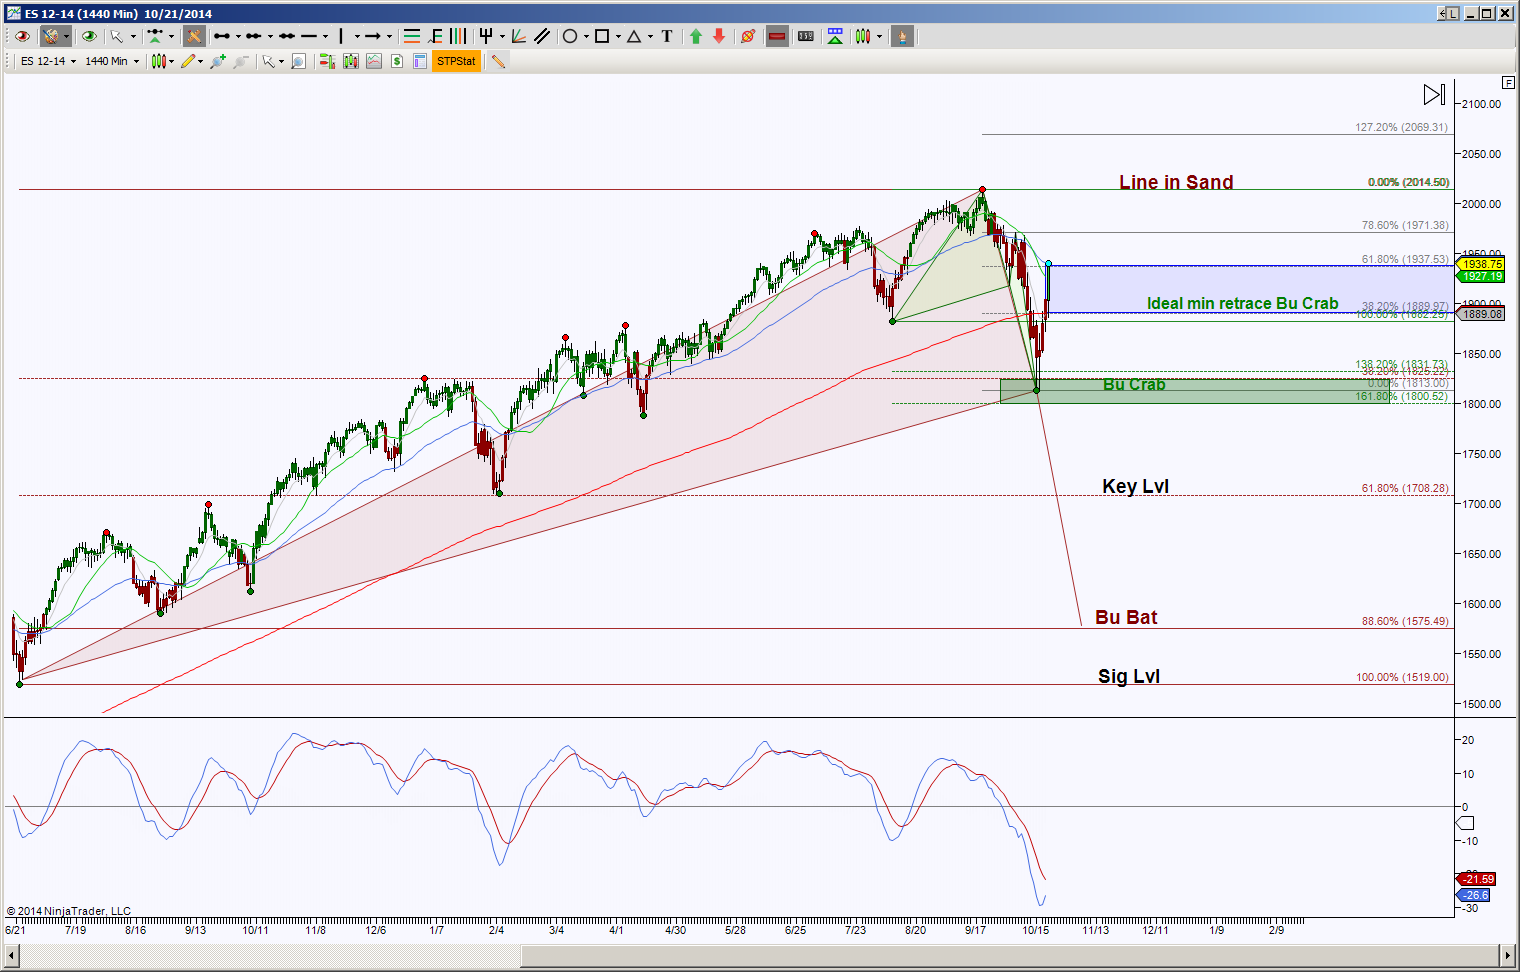
ES Emini Futures Day chart shows price has been in retracement mode of a bullish Crab and is currently testing the 61.8% retracement fib target. The symmetrical target is 1991.5 or 2139. To increase the probability of reaching those targets, the initial resistance to hold above has confluence, meaning there’s other means of resistance that correlate at this level of 1937.5. Failure to hold above 1937.5 implies a pull back to test 1890 as support and that becomes a very important support test because a break down there suggests a retest of 1800 region. Once price is able to hold below this 1800 area, the probability increases of testing much lower levels. Harmonically speaking the ideal target is 1575.5 with a key point of interest, aka a potential bounce point, at 1708.25.
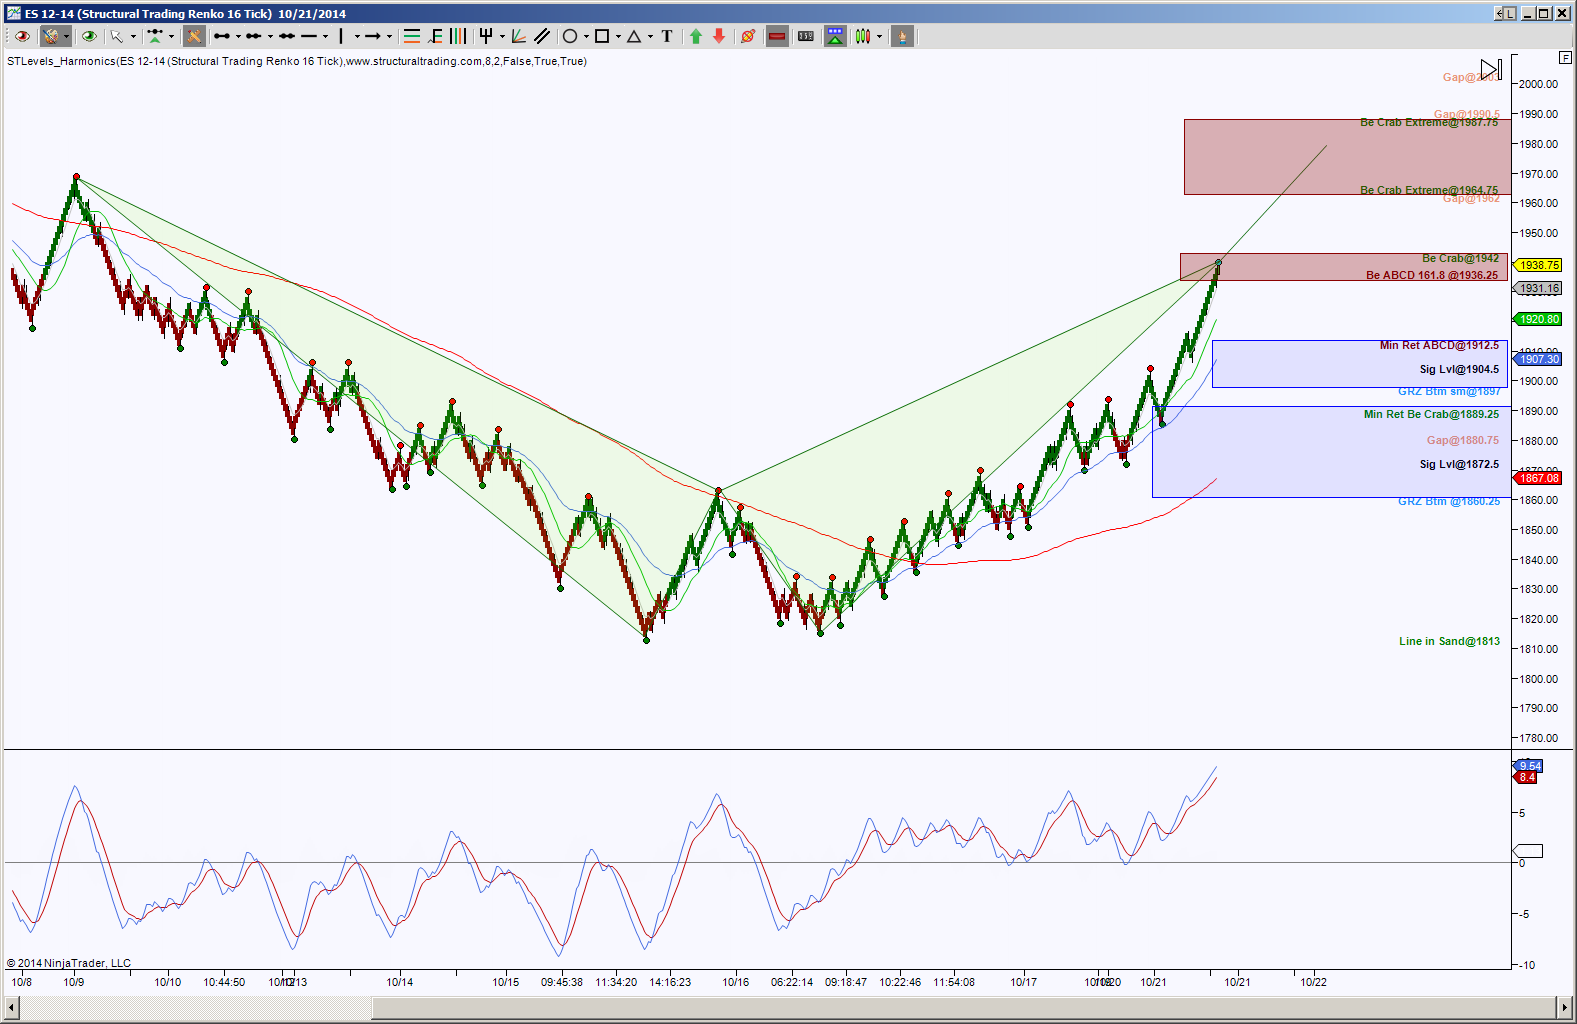
Remember how I said there was confluence at the 1937.5 area? Well if you don’t remember, then you weren’t really paying attention to the first paragraph in this post. Tap Tap Tap goes my foot. Anyway, look how an intraday perspective also has a harmonic pattern completion zone between 1936.25 and 1942. This is a double bearish PRZ which means there are two separate harmonic patterns that merge into this zone which just happens to encompass the day chart’s important resistance of 1937.5.
From an intraday view, there’s a potential stall in this zone, but a hold below 1936.25 has retrace targets of 1912.5 and 1889.25. A bounce upon these pull back targets keeps that larger zone above between 1964.75 and 1987.75 in play and guess what, this zone correlates with open gaps at 1990.5 and 1962. Correlating targets offer both magnetism and strength in their test.
Let’s be prepared in case there’s a pull back and price doesn’t find a bounce at these pull back targets. A hold below 1889.25 has the ideal target of 1813 and this will help price get closer to the 1800 region from the day chart’s perspective.