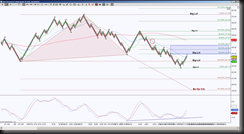
GDX had a bearish cross 9/23/13, current price action is threatening to invalidate that cross. Not familiar with those terms? A bearish cross comprises of a faster moving average crossing below a slower moving average, in the case of my 36 Renko Bar chart, I’m using a 20 sma and 50 ema. So since 50 is my longer moving average of the two, it becomes the line in the sand for the validation of the cross. So Friday, there was one bar that closed above the 50 and the closing candle has pulled back to test it as support.
This Renko bar chart is comparable to an hourly chart without the noise. The bigger picture scenario is, price is in an emerging Harmonic pattern, a Bullish Deep Crab, which has a completion target at 19.12 however, the emphasis is for price to hold below, not only the point of the triangle that is close to the GRZ (golden ratio zone) 24.98 level, it’s also necessary for price to hold below the originating point of the triangle level 23.79. So since price is holding above 23.79, the 24.98 becomes an important resistance test. A hold above 24.98 places the Bullish Deep Crab completion on hold, and has the green fib targets to form a potential new harmonic pattern. A hold above the top of the GRZ 26.37 lessens the probability of the Bullish Deep Crab playing out at this juncture.
For now, the key component is whether price holds above or below that 50 which is at 24.50 AND whether price holds above or below that GRZ 24.98 level.

