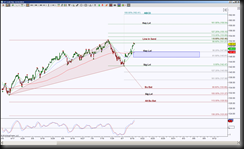
The Transportation ETF, IYT shows an attempt to retest 152.40 providing an important Fibonacci level at 151.27 fails to hold as resistance. Although I would not suggest a trader trade another market like the S&P Emini Futures looking at another instrument like IYT, I do like to take into consideration what important levels IYT is testing in regards to trading ESU14 setups.
For instance, as we all know, since the August 8, 2014 low of 1890.25, ESU14 has been pushing upward, as well as IYT has been pushing upward after the pull back to the 142.47 low. I’m using a 2 hour chart to show how price is in between opposing emerging patterns and the divider or line in the sand level is 152.40. There’s also an attempt to form another harmonic pattern which requires a hold below 151.27 and a pull back to at least 147.88 and at the most 142.47, so these become important levels to watch price behavior.
 For now, this chart shows there is a potential pull back to 150.40, 149.01 or ideally 147.88, it will be at this juncture that we see which opposing harmonic pattern has a higher probability of playing out. A hold above 147.88 or 151.27 has that important resistance test target at 152.40, above there invalidates the brown colored Bat and a hold above 152.40 increases the probability of testing 162.41 ABCD target and scaling points at 153.69, 155.10 and 158.54.
Should we get the pull back to 147.88, and price fails to hold above there but rather holds below it, then we have the ideal target at 133.68 and scaling points at 145.81, 142.47, 140.09 and 137.06. Keep in mind that scaling points are also considered potential rejection or reversal points so they are regions to protect profits in an existing trade or be willing to exit the position.
Since S&P Emini futures often are complimented by IYT, how the latter behaves at the above mentioned levels, I’d be aware of ESU14 behavior at it’s simultaneously tested levels.
