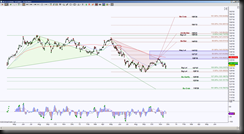
ZB_F is approaching a very important level regarding opposing emerging patterns. The line in the sand is 128’13.
A hold above the line in the sand level keeps price inside the range between 135’19 and 128’13, it also keeps the brown pattern in play. So the important initial resistance test is top of range 135’19, a hold above there offers a conservative long opportunity to the completion targets for the brown pattern.
This particular harmonic pattern has the initial completion target at 145’03, the secondary target at 149’21 and extreme extended target at 158’26. The three targets are not to be confusing but rather offer upside targets and a rejection probability at each level. Understanding price action at these levels is of the utmost importance.
A hold below the line in sand level 128’13 has two targets for completion of the green harmonic pattern. The initial target is 125’05 and the extreme extended target is 118’26.
The Garfly harmonic pattern is one that I named because of it’s combined efforts of two popular harmonic patterns, the Gartley and the Butterfly. I’ve witnessed uncountable times where this scenario has been efficient and successful.

