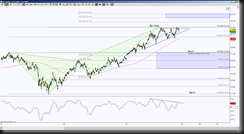
The Financial Sector day chart shows price is in a pullback to test support mode. There are two important scenarios occurring, first being a very large harmonic pattern, Bearish Crab, has completed at 21.04. The second being, since the completion of the Crab, price has stalled in the form of an ascending triangle.

The Bearish Crab began it’s harmonic pattern journey back in February of 2011. It took almost 3 years to complete which had minimal use for intraday perspective until now. When intraday price is testing a very large harmonic pattern PRZ (potential reversal zone aka completion target) then be cautious in that region. There is a potential breach to test BC extension targets 21.81, 22.47 and 23.10 (GRZ is 22.47 to 23.10) GRZ is Golden Ratio Zone. This potential breach is minimal on the scope of the size of the pattern, for intraday perspective it would be a big move.
When price stalls at a PRZ and begins to consolidate as in the Ascending Triangle, this offers a more conservative entry with a break and hold beyond the triangle parameters, or a exit strategy for an existing long position. Just because the title is Ascending Triangle, the edge of a breakout to the upside is minimal so it’s best to be prepared for either side of a break, then be cautious of false breaks, it’s a conservative approach to wait for a closing candle outside the triangle, then a test and hold of the breakout point.
At this juncture, price is attempting to return to the bottom of the triangle with the initial support tests at the rising moving averages. Note that the apex of the triangle is nearing so failure to breakout prior to reaching the apex risks an alteration of the consolidation, either an expansion of the triangle parameters or a transformation into a rectangular formation.
Putting the two major scenarios together, a hold above 21.04 is a breakout of the triangle to the upside and the GRZ level 23.10 is the ideal target with scaling points at 21.81 and 22.47. A hold below 19.59 is a breakdown of the triangle and has an important support test target at 17.20, this is the ideal minimum retracement target of the Bearish Crab and how price behaves at this region defines the probability of the next bias.
