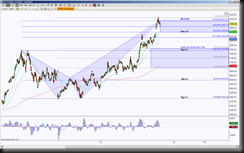
PCLN has retraced a harmonic bearish Crab pattern, the initial test of the PRZ (Potential Reversal Zone aka completion target for a harmonic pattern) has a rejection. How much price retraces this pattern makes a statement.
- The ideal minimum retracement target is 783.92, what’s interesting with this target is it has correlation with a significant level 774.96. What’s more interesting is that this is not uncommon for the retracement target to have confluence with a significant level determined from the beginning of a pattern
- The initial ideal pullback target is what I call the GRZ (Golden Ratio Zone) at 859.59, this also has confluence with a rising 20 dma (daily moving average) … again confluence which gives strength to this support test, currently price is testing the half way mark of the GRZ at 885.73
- A breakdown and hold below 859.59 increases the probability of the 783.92 target, a hold of 859.59 implies a retest attempt of the top of the GRZ 911.87 which correlates with the Bearish Crab PRZ
- There is a potential breach of 859.59 to fill a gap at 855.16, the factor is where does price end up once it can break below 859.59 and fill the gap, thus the statement of “a hold below”
- A hold above 885.73 (this is also failure to test bottom of GRZ) implies a stall point between 885.73 and 911.87 and these become initial support and resistance levels to break and hold
- How much this Harmonic Pattern retraces tells a story … failure to retrace more than 783.92 (or failure to even get to 783.92) states probability of upside continuation, especially with break above 926.40
- Failure to hold above 783.92 states downside bias while in retracement mode, the stronger the Harmonic Pattern, the more retracement occurs, having 100% being the ideal target at 553.42
*********************************************************************************************************
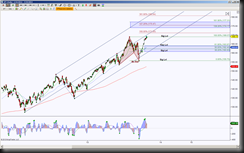
SPY completed a Harmonic Pattern called Bullish Bat, this pattern has retraced over 100%, now what does a harmonic trader look for?
- So what happens when a harmonic pattern retraces 100%? This 100% level becomes a new line in the sand
- SPY’s 100% level is 169.07, a hold above there has extension targets for the retracement continuation, the next target being the extended GRZ (Golden ratio zone) levels 174.17, 175.47 and 177.31 with a scaling point at 171.25
- A hold below the 169.07 line in the sand is the initial GRZ formed from the retracement of the harmonic pattern, the levels being 163.97, 162.40 and 160.83.
- Depending on the slope of an incline (with a hold above 169.07), there could be correlation of the Andrew’s Pitchfork with the upside targets, in other words if price moves steeply to upside, the 171.25 target has correlation with the Pitchfork midline.
- Depending on the slope of a decline (with a hold below 169.07) price could have correlation with the pitchfork support channel line and one of the GRZ targets. Regardless of the slope, 163.97 will be a noteworthy support test
- Regarding the Pitchfork, price had a failed attempt to hold above the midline, after the breach of the midline price retraced a greater degree since the formation of the Pitchfork
- This scenario suggests more selling occuring at pullbacks, however until price can break down the Pitchfork and hold below it, the bias remains to the upside.
- A hold above the midline increases the upside bias having the top of the channel as the target


