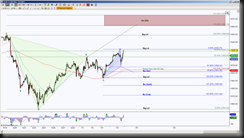
ES approaching a line in the sand level 1630.75. How price behaves at this level offers increased probability of an emerging pattern playing out.
- There are opposing emerging patterns and the 1630.75 has the ability to invalidate one of them
- If price fails to breach 1630.75, the initial support test is 1621
- A breakdown of 1621 has 1602 completion target for Bullish Gartley (blue pattern) with scaling points 1617.75, 1608 and an important level 1604
- If price holds above 1630.75, it invalidates the emerging bullish Gartley and turns the focus onto the completion target of large bearish Butterfly (green pattern)
- Upside completion target is initially 1661.5 for bearish Butterfly, with scaling point at important level 1649
- Note the 1604 is an important level because harmonically speaking, a breach of it to the downside changes the dynamics of the green pattern (bearish Butterfly), the pattern would remain a butterfly but the emphasis on the completion is more geared toward the 1675 rather than the 1661.50
***************************************************************************************************************
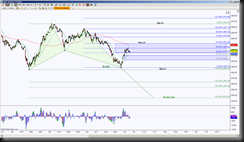
AAPL has been in retracement mode of a Bullish Bat, so far the 50% level has created a stall point.
- Price is currently in sideways range of 422.99 and 414.93, these levels represent the GRZ (Golden Ratio Zone) levels represented by the midline and the bottom of the zone
- A hold above 422.99 implies a test of the top of the GRZ, which is a 61.8% retracement of the Bullish Bat, this is an ideal retracement and sets up for a couple different harmonic rotations
- A hold below 414.93 has initial targets at a smaller GRZ, 410.14 to 402.02, harmonically speaking, a pullback to the smaller GRZ offers a new pattern that automatically offers significant support and resistance levels as well as a completion target of 449.32.
- A bullish cross, represented by a fast moving average crossing above a slower moving average typically will be tested as a valid cross, failure to hold above 410.14 makes the cross suspect, a hold above 410.14 implies the cross is valid and keeps an upside bias to continue the retracement mode
- A hold below 402.02 has an important support test at 388.87, and a breakdown of 385.10 has a bearish bias to complete the emerging Bullish Deep Crab at 335.26, with scaling points at 363.16 and 354.29
- Scaling points represent an area of importance to take some profits, protect a profitable position, to exit a profitable position or to stalk a potential reversal
***************************************************************************************************************
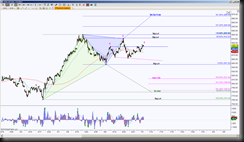
GOOG in between opposing emerging patterns having a line in the sand at 920.60. Intermediately there is a support level at 891, a breakdown there implies the potential Head & Shoulders’ right shoulder is formed.
- If the right shoulder is valid, a hold below 891 offers a short opportunity to the neckline, a potential breach there to test the 847.22 level
- A breakdown 847.22 invalidates the opposing emerging pattern, blue Bearish Deep Crab, and places focus on the 779.42 completion target with scaling points at H&S targets 812.48, 799.86 & 783.81.
- A hold above the 891 level offers a long opportunity to important resistance test 912.23
- A breakout of 912.23 has ideal target at 965.95 with scaling points at important level 920.60 and 940.56
- If price takes out 920.60, it invalidates the large opposing emerging pattern, green Bullish Bat


