Below is analysis for 11/22. I’m feeling a bit under the weather & hopefully you’re all getting ready to spend time with friends & family for Thanksgiving. I am grateful for you all. Rather than post all charts, I’m going to just make some comments.
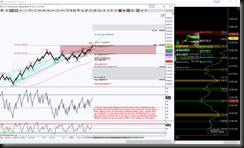
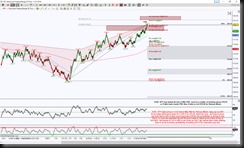
ES_F Even tho price is holding above the PRZ & made a new hi, there’s still a lackluster of conviction, as long as can hold above 2196.5 the implication is upside continuation to 2229.25.
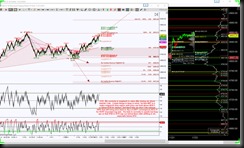
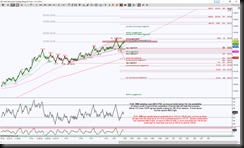
NQ_F invalidated the brown Bat & now its a matter of holding above 4878.75 to head for the brown ABCD tgt 1991.5. Tue RTH session was very balanced so needs to initially hold above 4888.25 or below 4862.
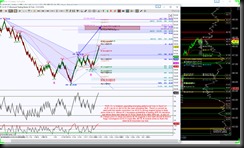
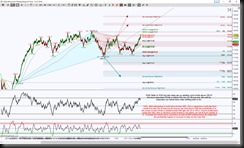
CL_F pretty darn close to same range as prev day so analysis remains in tact as shown in video / chart below. Added note, price has pb to test 47.3 tgt & currently toying whether to hold above or below inv H&S neckline. Still needs to brk & hold outside of blue GRZ but 47.3 is initial important sup test.
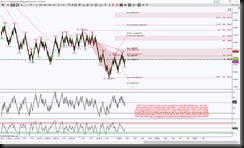
GC_F still undecided whether to hold above or below 1213.4 lvl derived from Day chart. The brown emerging Bat has shifted to a Gartley meaning 1226.3 is ideal PRZ tgt vs 1229.5.
SPY is in Crab territory vs Bfly so not going to change the retrace tgts until either price tests 221.84 or holds back below 219.97 for starters then more important below 218.96.
IWM invalidated the brown Bat & pushed up to complete the cyan ABCD 127.2% tgt at 132.69. There is some expansion so potential stall or pb to 132 area for important sup test. Upside continuation (a hold above 132.96) has 133.9 & 134.31 next tgts.
QQQ stil in between opposing emerging patterns w/ do or die for cyan Bat at 119.66. Due to expansion potential pb tgts are 118.3 & 117.29 to start with.
The stock charts posted so far this wk have same harmonic scenario if there’s no updated chart. The Day Swordlines for ES, NQ, CL, GC futures & SPY can be refreshed using the STLevels indicator. These charts may just show the Week and Month Swordlines.
When intraday levels or patterns are exceeded or invalidated, please refer to charts posted for the week, click here.
Click here for video on NQ_F, CL_F, GC_F
Have a question about an instrument not listed? Just ask me.
Trading involves substantial risk and is not suitable for all investors. Past performance is not indicative of future results.

