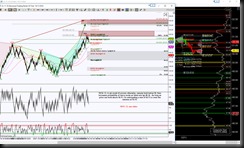
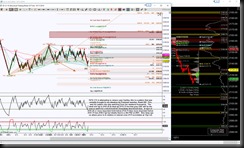
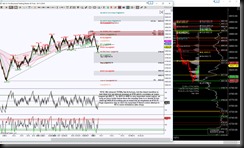
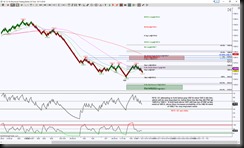
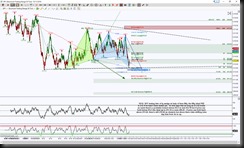
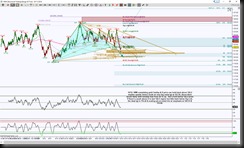
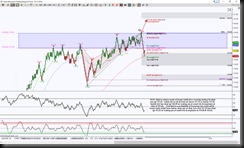
The stock charts posted so far this wk have same harmonic scenario if there’s no updated chart. The Day Swordlines for ES, NQ, CL, GC futures & SPY can be refreshed using the STLevels indicator. These charts may just show the Week and Month Swordlines.
When intraday levels or patterns are exceeded or invalidated, please refer to charts posted for the week, click here.
I have a commitment that makes it difficult for me to update the charts in the manner I normally do. Below are some comments but if you need more info, please skype (kathyg1111) or email me and I’ll address in the morning:
ES & NQ both had inside days of yday so the analysis from 10/12 remains in tact.
CL has pulled back to the 49.97 target, this is key support & offers directional bias in regards to where can hold beyond there. There is risk of shifting intraday bias to down below 49.97.
GC still stalling under gray GRZ 1257 so refer to 10/12 chart.
SPY bounced into the 214.23 SL to 214.42 tgt for a resistance test. Initial levels to break and hold are above 214.42 or below 213.62. Intraday bias remains to dnside unless price can initially hold above 214.42.
IWM so far has an embarrassing retracement of bullish Gartley, it’s ideal min tgt is 123.07. The intraday bias is still to dnside & as long as holds below 122.2 implies a test of 121.16 or 120.55 for buyers to have another oppty to step in.
QQQ is stalling at ideal min retrace tgt of bearish Gartley at 117.25, initial lvls to brk & hold are above 117.79 or below 117.25 then more important 116.49.
Refer to videos posted for 10/11/16 & the charts below from 10/12
Have a question about an instrument not listed? Just ask me.
Trading involves substantial risk and is not suitable for all investors. Past performance is not indicative of future results.

