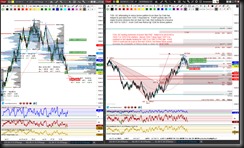
I just got home and I’m tuckered … so I’ll just make comments for tomorrow. Below are charts for 7/25, with new comments above it.
When intraday levels or patterns are exceeded or invalidated or you want more detailed analysis, please refer to charts posted for the week, click here
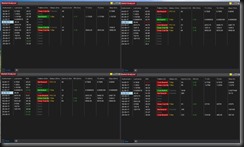
Futures Pattern Scanner by Neoharmonics:
Intraday Harmonic Charts:
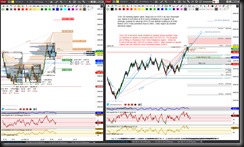
ES had balanced range similar to Tue upper profile, this is chop area between 2478 & 2473. Still looking for upside tgts 2483 or 2510.75.
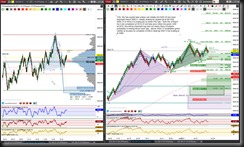
NQ invalidated the Shark & green Gartley & reached the green ABCD at 5980, STRangemarker hi/lo is now 5994.75 & 5979, these being initial lvls to brk & hold.
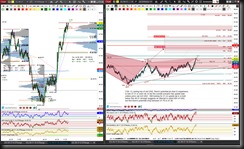
CL failed to fill in dbl distribution from Tue, this was clue of upside continuation. Wed had balanced day, bias is still to upside but there is some neg div on momo & it’s not inside OB region so this implies potential pb to 49.57 to 47.51. Ideally still looking for upside tgt of 51.24.
GC still in vicinity of brown Alt Bat PRZ, initial lvls to brk & hold are STRM hi 1266.2 or lo 1262.7. Upside brk has ideal tgt 1287.5. Dnside brk has important sup test tgt 1255.7, below there would increase probability of Retrce Mode of Alt Bat, having ideal min tgt at 1241.5.
Have a question about an instrument not listed? Just ask me.
Disclaimer:
Structural Trading is not an investment adviser, nor a securities broker. Information shared here is intended for educational purposes only.
All methods, techniques, indicators and setups shared by Structural Trading are not a guarantee of success or profit.
Futures and Forex trading contains substantial risk and is not for every investor. An investor could potentially lose all or more than the initial investment. Risk capital is money that can be lost without jeopardizing ones’ financial security or life style. Only risk capital should be used for trading and only those with sufficient risk capital should consider trading. Past performance is not necessarily indicative of future results.
Hypothetical performance results have many inherent limitations, some of which are described below.
No representation is being made that any account will or is likely to achieve profits or losses similar to those shown; in fact, there are frequently sharp differences between hypothetical performance results and the actual results subsequently achieved by any particular trading program. One of the limitations of hypothetical performance results is that they are generally prepared with the benefit of hindsight. In addition, hypothetical trading does not involve financial risk, and no hypothetical trading record can completely account for the impact of financial risk of actual trading. for example, the ability to withstand losses or to adhere to a particular trading program in spite of trading losses are material points which can also adversely affect actual trading results. There are numerous other factors related to the markets in general or to the implementation of any specific trading program which cannot be fully accounted for in the preparation of hypothetical performance results and all which can adversely affect trading results.
It is advised to NEVER follow a trade setup blindly, but rather always understand why a trade is entered and have risk management defined before entering a trade.
Structural Trading will never share or sell personal information of members.

