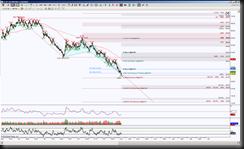
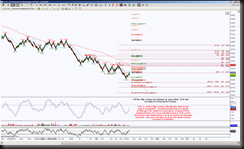
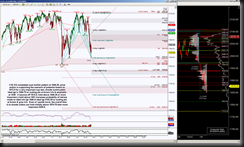
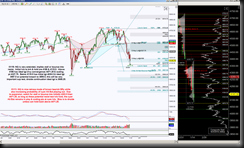
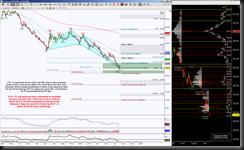
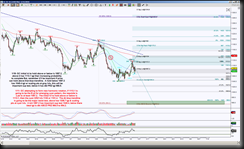
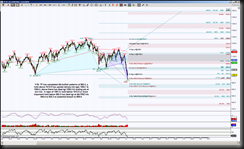
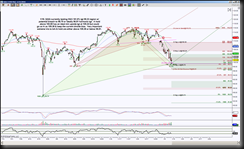
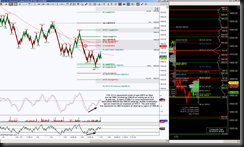
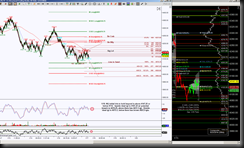
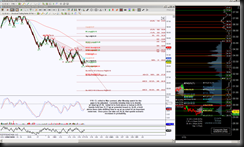
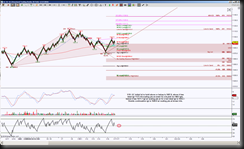
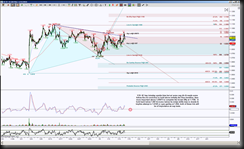
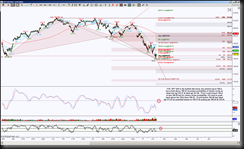
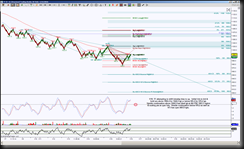
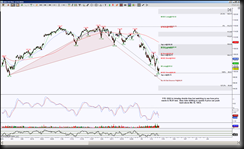
CL Day chart & Intraday March contract charts added, if you have these charts opened before the changes, you’ll need to refresh STLevels.
Day chart comments – CL pushing the limits of cyan Crab, could still breach 30.68 to test 27.61 ABCD, but if can hold above 33.43 implies retrace mode attempt w/ 41.79 being an important component regarding resistance.
There are swing charts for some stocks included. Some members only trade futures, others stocks or ETF’s. It’s not meant for an individual to trade all these instruments at once, but rather choose favorites. The best trades are those that one is able to focus on, so two or three max is suggested, to watch or trade. I suggest setting alerts at distinct targets then you don’t have to watch each instrument.
You need the STLevels Swordlines indicator to view this week’s Stocks with Mo/Wk STSwordlines: IBB, IWM, QQQ, SI_F, TF_F, YM_F (however, if you don’t use the NT indicators & would like to view the levels, please let me know)
Mo/Wk/Day SL’s (Day SL’s change daily): ES, NQ, CL, GC futures; AAPL, BIDU, SPY
STDayCharts levels: ES, NQ, CL, TF, SPY (some previous charts may still apply in their analysis that aren’t noted here, just do a search for the symbol in the blog )
STHarmonics levels are included in all charts I post in the blog
Refresh STLevels for updates.
Please refer to these charts for the week, these are the bigger harmonic scenarios & these levels are to be referred to when an intraday scenario is exceeded.
Intraday Charts:
Reminder: I have begun to create short videos for members for each item in my Terminology Page. You need to be an active member and logged into Structural Trading to have access to them. It is a work in progress so please be patient for me to complete the whole list. You can access it two ways, use this link: https://structuraltrading.com/help/terminology-videos/ OR when you go to https://structuraltrading.com/ just hover your mouse of the “Help” tab and you’ll see listed Terminology Videos, the titles that are colored in blue have a video. This will be updated as time permits.
Make sure when you click on the title, that you scroll down to the bottom to choose which recording to watch because you may have choices, example: http://screencast.com/t/T9xIbIIqCG

