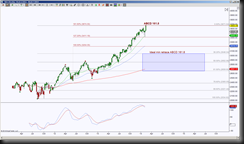
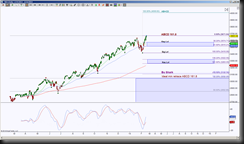
The NASDAQ 100 Index is testing the ABCD 161.8% target at 3671.04. How much, if any, retracement from here is important. A shallow retracement implies a stall or upside continuation. A retracement below the GRZ (Golden Ratio Zone) implies an attempt to have a nice harmonic pattern retracement mode thus setting up for a new harmonic rotation.
 The week chart shows price testing this very large ABCD extended completion target. The STPesavento indicator (the red dot) is suggesting this upside move has probability of stall or completion. Should the upside dot return to cyan color, will eliminate this current bias. If price moves away toward the downside, the red dot is valid for this particular upside rotation. The ideal minimum retracement target is 3046.04.
 The day chart shows an upside cyan dot implying there could be a breach of 3671.04 because the bias remains to the upside. Momentum enforcing this view on this timeframe. A hold above 3671.04 has another ABCD target at 4008.63. A hold below 3671.04 has the small GRZ target 3574.71 as the initial important support test, a break down there has the larger retracement GRZ target at 3406.04, from the weekly perspective. Note there is an emerging Bullish Shark in play, a completion of this harmonic pattern will help accomplish that ideal minimum retracement target at 3406.04.
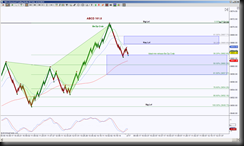
 To fine tune the perception of what is happening at this 3671.04 level, I’ve looked at the STRenko 40 Bar size for an intraday look. There was a bearish Deep Crab (shown in green) completion which helped complete the weekly ABCD 161.8% pattern. This bearish Deep Crab has retraced its ideal minimum at 3662.90, what happens from here gives us clues for the higher time frame scenarios.
Currently the 40 Bar STRenko chart has a downside bias while in retracement mode, but a hold above 3662.90 has an initial resistance test at the small GRZ 3665.65, above there shifts the immediate bias to upside with upside targets at 3667.71 and 3671.04.
A rejection of 3665.65 or hold below 3662.90 keeps the downside bias and has the ideal target at 3649.73 for a 100% retracement of that bearish Deep Crab and scaling points (if you’re trading intraday) at the green fibs. A 100% retracement helps price on the daily and weekly perspective move away from that current resistance level 3671.04.
