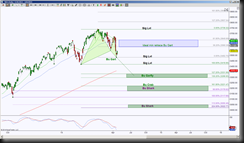
NDX has recognized a day chart’s Bullish Gartley and is attempting to go into retracement mode with the ideal minimum target at 3580.38. If price can get there and what happens at that price tells a story of probability and directional bias.
 The day chart shows the Gartley completed at 3482.75, and the GRZ is the initial retracement target at the 3580.38 and 3640.69 zone. Failure to get there or a rejection of 3580.38 is a sign of weakness, especially if price rejects with power and pushes price below 3482.75. It would be at this juncture that the double bottom target of 3418.88 becomes the next significant tell because a hold below there increases the probability of testing the downside targets of 3331.99, 3221.47 and 3050.49.
If you have seen any of my posts, then you’re aware that I like to narrow the focus and go to an intraday chart seeking harmonic rotations that can help accomplish the scenarios outlined on the day chart. You’re also aware that I like to be prepared for multiple scenarios because this helps me keep an acceptance of what unfolds without attachment to the outcome and reluctantly I admit this helps my need to feel like I’m right.
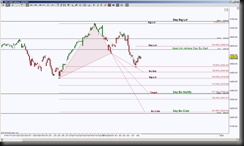
 The intraday chart, in this case a 5000 volume chart, shows an interesting harmonic scenario. Interesting in that the current formation has the ideal completion target at 3543.86 but the fib at 3484.54 found buyers and the essential part of this is how strong are the buyers. If they can push this price above 3598.53, it will change the dynamics of this current emerging pattern.
To keep it simple, the main focus I want here is that there are targets on the intraday chart that will correlate with the day chart’s targets, this makes these levels both magnets and stronger levels when tested.
If price pushes up to 3598.53, this puts price inside the daily GRZ and once inside implies a probability of testing the other side, in this case the 3640.69 level. Above there has the ideal target of 3725.71 which in turn helps price test that daily Significant Level of 3738.32.
If price rejections 3580.38 or 3598.53 or more importantly breaks down 3484.54, then the initial target is 3453.86 but here’s the interesting part, if this level creates a shallow bounce or no bounce at all, then the magnet targets of 3335.42 and 3229.26 increase in probability of being tested.
My STPesavento indicator as shown with the cyan dot currently offers some positive divergence, however follow through is a necessity and a valid breakout of the little blue channel increases that scenario. Otherwise price could channel its way to the 3484.54 level or break down with increased momentum.
