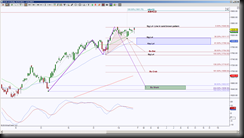
The S&P Emini Futures day chart shows price has been holding inside a range between 1846.50 and 1811.25. Harmonically speaking, this is more often than not, indicative of opposing emerging patterns battling it out. There will always be levels that determine an invalidation of one or the other.
 This chart shows that the invalidation level for the brown pattern (this is reference to the color coordinated triangle and fibs rather than a specific pattern named “brown”) is 1846.50, so as long as price holds below this “Line in the Sand” level, the brown pattern hangs on for dear life. The reference for the hanging on is derived from the fact that price is currently toying with this Do or Die level. Even a one tick breach invalidates the pattern, so that is why if harmonic patterns had feelings, this one would be feeling pretty worried about fatality. I chuckle at the thought of personalizing these patterns but after all, I interact with uncountable patterns every trading day and some non-trading days.
Different style of traders can trade so hugely different, some may only trade futures, some only options, some only stocks or ETF’s, and within that, some traders only trade one instrument while others trade hundreds. An advantage to trading the same instrument/s repeatedly is getting to know the personality of it, some move like it’s a relay race, others stroll, and there is typically symmetrical movements that like to repeat themselves, in other words, if a Bullish Bat harmonic pattern forms, there may be multiple Bat’s that form for a series of movement.
But I digress, back to the chart at hand, the current personality of this instrument is like pacing back and forth, undecided on which way to go and just about the time the viewers of price action think it has a chance to break out into a run, it hesitates and keeps wearing down the sideways path. The good thing about this scenario is the viewers can see what needs to break and hold to determine a true attempt to move on.
The opposing patterns in this chart are ABCD patterns that have completion targets to the upside above 1846.50, and the patterns that have downside completion targets are the brown pattern, a Bullish Bat and its extended partner the Bullish Crab and a Bullish Shark. Keep in mind that when harmonic patterns are forming their last leg, it’ll be opposite of it’s type. In other words a break down of 1811.25 has a downside bias to complete the bullish patterns, they do not become bullish until they are complete and valid.
The last leg of a harmonic pattern can be fun to accompany price, offering targets to scale, tighten a position or exit a position and possibly look for a reversal setup. So on my chart, a hold above 1846.50 offers a long opportunity to the double bearish ABCD targets, this tells me that 1900 region is a place to take profits or get ready to exit. And a hold below 1811.25 offers a short opportunity to the ideal target at the largest harmonic pattern PRZ (Potential Reversal Zone aka the completion zone) at 1639.25 and scaling points at 1764.5, 1754, 1718.75 and 1697. Remember, my scaling point levels have a high probability of being a rejection point also.
