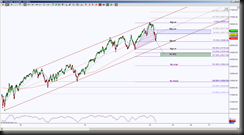
The DJI day chart perspective shows 15817.18 has confluence resistance region. Confluence is derived from different aspects of analysis merging into a zone. The Day chart shows that price has been in an uptrend channel since October 2011. The finale of 2013 was the high of 16588.20 at the retest of the channel resistance line, 2014 began with a stall at that region followed by a break down of consolidation to push below the channel midline, and is currently bouncing back to that midline for a resistance test.
 Looking at the Day chart shows that this test of the midline of the channel correlates with the GRZ (Golden Ratio Zone aka the zone of the Fibonacci levels 38.2% to 61.8%). Confluence behaves as a magnet calling price to it, then acts like a stronger level and has more meaning if that level fails to hold price from pushing through it, in this case since it’s a resistance level, it makes a statement for the bullish bias if can hold above that 15817.18 region.
The harmonic rotation scenario is the test of the confluence region is a requirement to form the third leg out of four legs needed to complete a harmonic pattern. To play out this emerging pattern as shown in purple fibs and triangle, the upside move to form this third leg can go as high as 16588.20 and remain a valid pattern, however a test and hold below 15817.18 implies the leg has completed, and the probability of completing the final leg and completion increase with first, a break down of 15266.96, then 14719.40.
Note the initial support region to break down and increase the downside probability correlates with a retest of the channel support line, so again, confluence, and again, it makes a statement with what price does once it gets there.
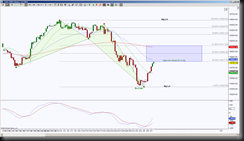
 Next, looking at an intraday chart, in this case a 5000 volume chart. There was a completion of a harmonic pattern, called Bullish Crab that has begun its retracement mode. That GRZ level 15817.18 is this pattern’s ideal minimum retracement target, a hold above there implies an attempt to retrace the ideal ratio of 100% and the gray fibs along the way are points of interest aka potential rejection points. Failure to hold above this GRZ has a shallow retracement, this is a strong suggestion of weakness which in turn supports the daily perspective of retesting the channel support line.
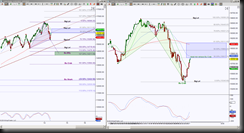
 I use an indicator that signals swing completion, the green, red and cyan dots are this indicator. When the cyan dot is on top of the bars, it indicates the upside move is still forming, once it is complete, it’ll turn red. (Just like if the cyan dot is on the bottom of the bars, the forming move is to the downside and once the dot turns green implies that move is complete). Looking at both the day chart and 5000 volume bar chart side by side, it is visually clear that the upside move is still forming.
I’ll be watching to see how price behaves at this GRZ, it is an important test. The harmonic strategy offers an opportunity to trade long if price holds above 15817.18 with the next important tests aka scaling points at 15964.40 and 16111.62, above there increases the probability of upside continuation with the ideal target at 16588.20.
The harmonic strategy offers a short opportunity with a hold below 15817.18 to the initial important support test at 15340.60 and point of interest at 15600.39. A break down of 15340.60 has the ideal target at 12420 and scaling points aka potential rejection points at the daily purple fibs.
If you are not familiar with harmonic patterns, just watch the levels laid out in this commentary and see how the harmonic story unfolds, it could be a journey to enjoy, to be amazed or to be like I am every time another harmonic scenario plays out, in awe!
