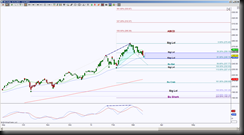
IBB, the ETF for Biotechnology is reacting to negative divergence with a pull back to test a very important support region. How price behaves at the 250.90 to 249.15 area offers bias for directional targets.
It’s a good idea for a trader’s toolbox to include a means of determining momentum and divergence. There are numerous ways to interpret this type of price action and it is strictly a personal preference. I’ve begun incorporating market flow and delta divergence into my own charts, but there are indicators such as Stochastics, MACD and RSI that can offer similar clues.
 This particular Daily chart has a simple MACD indicator showing an extreme difference in upward slope while price had a dramatic upward slope making a higher high, this is a great example of momentum preceding price and as is evident on the chart, price fell after making that higher high.
For those who utilize moving averages for trend strength, the upside trend has been validated repeatedly. This chart only goes back to October 2013, but this particular bullish cross occurred November 2012 at the 125.63 low, and since that cross the bias has been uptrend.
Now price is approaching another test of the my slower MA which happens to correlate with my GRZ level 249.15. (GRZ aka Golden Ratio Zone, for more information please refer to my terminology list.
Harmonically speaking, a hold below 249.15 has a long term ideal target at 183.12 but scaling points or potential reversal points along the way are the cyan fibs and 191.29. A hold above 249.15 implies a resistance test of 259.18, and a hold back above there keeps price in a sideways range unless can take out 275.40.
A hold above 275.40 has ABCD targets as shown with the brown Fibonacci ratios.
So the bullish cross validation test along with the GRZ support test is very close, how price reacts to this test is key.
