
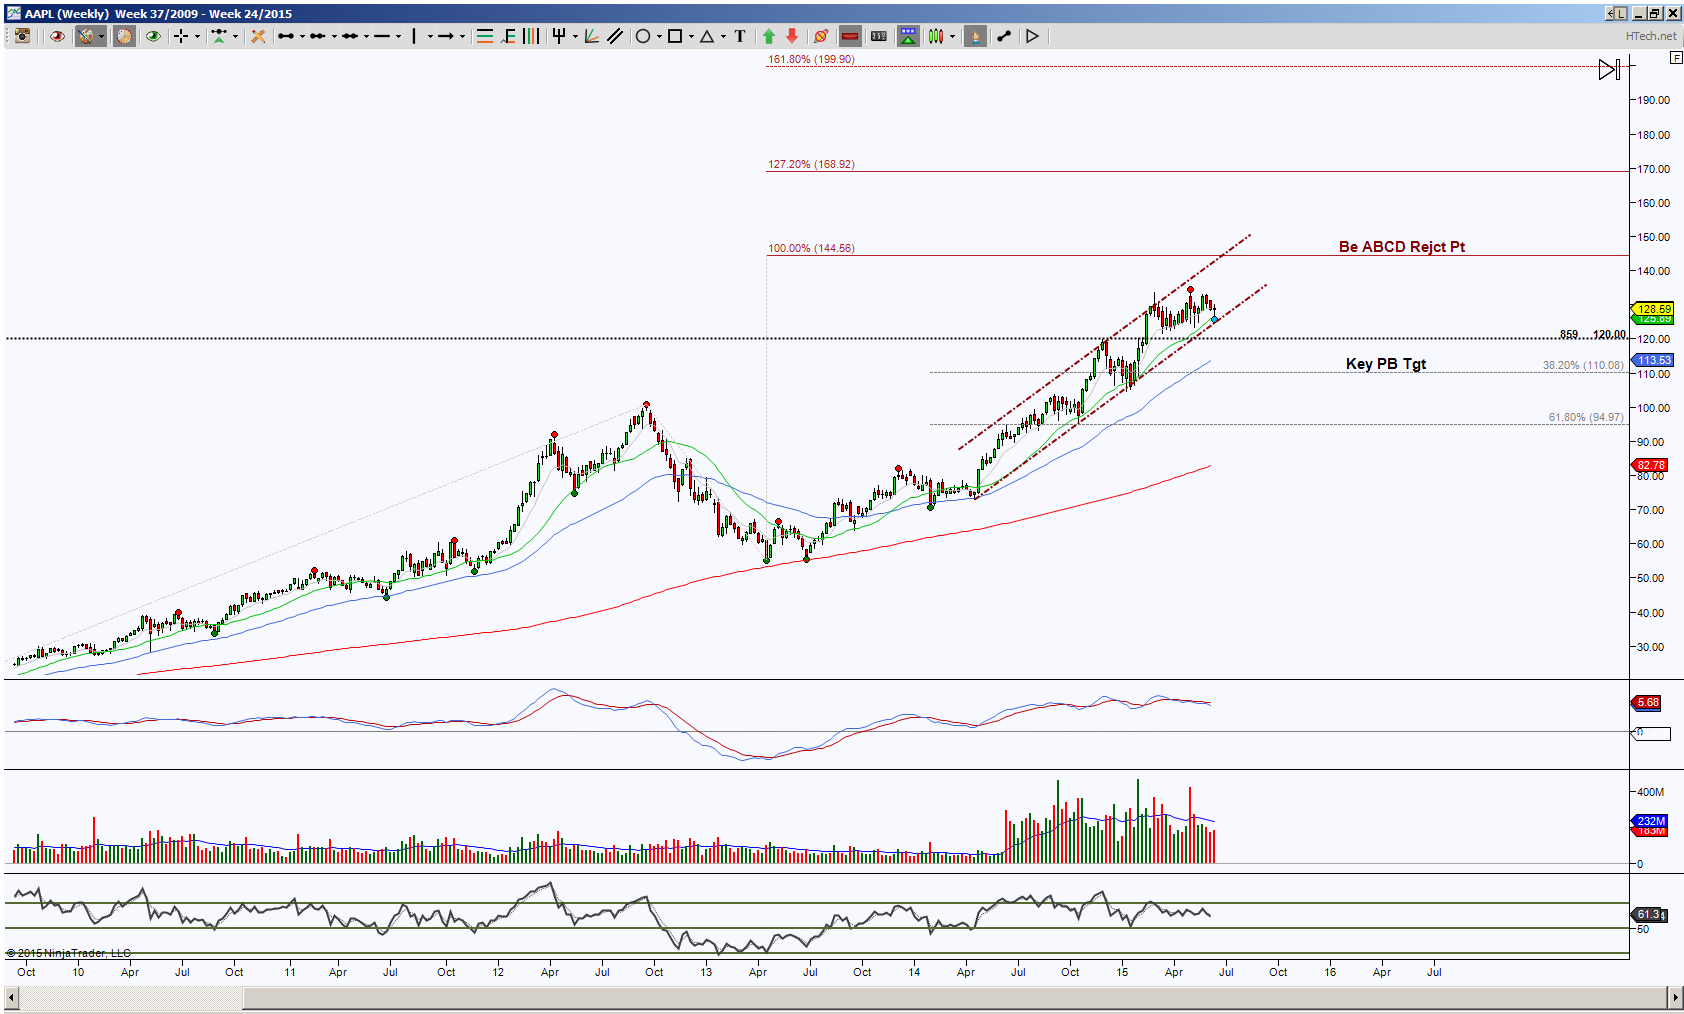
AAPL longer term view, a week chart, shows price has been in an uptrend but with negative divergence. This implies the upside continuation is losing its luster and will need some oomph to move onward. There is an ABCD measured move target at 144.56. Currently price is testing the bottom of the channel, there’s a potential breach below it to test 120 or 110.08 but what is key is what occurs after a breach. As long as price can hold inside the channel, the probability remains of completing the ABCD.
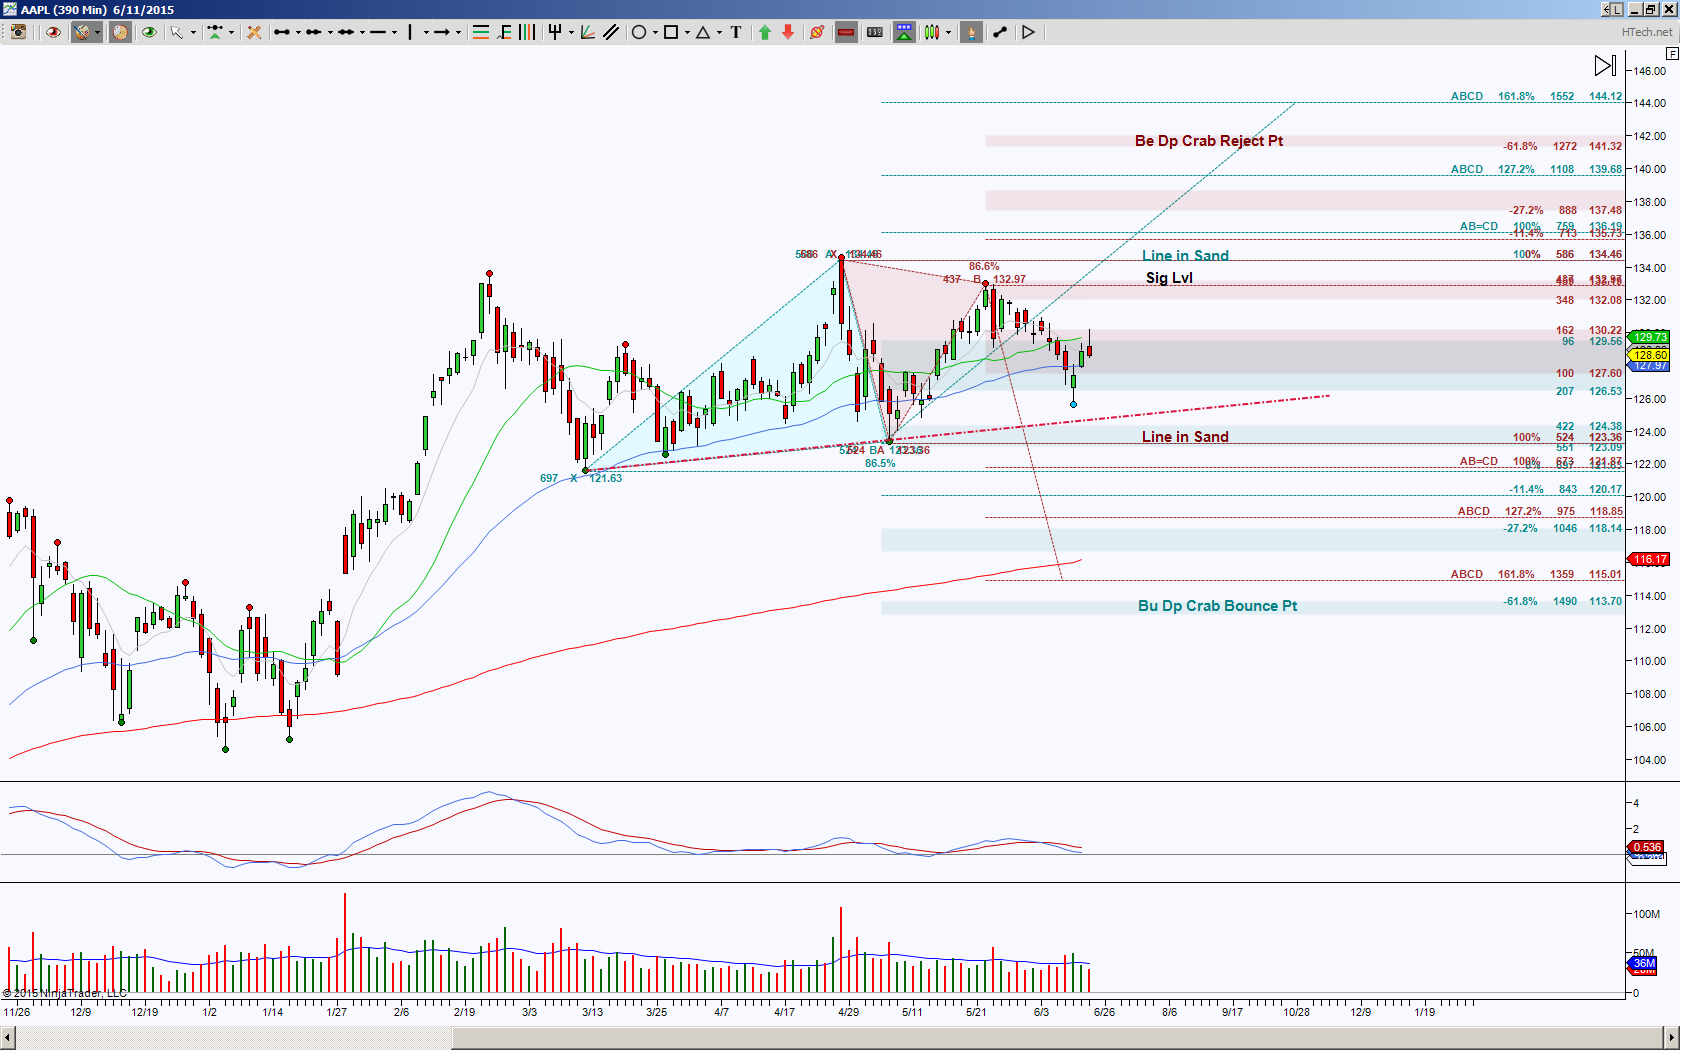
The Day chart shows price is in between opposing emerging patterns, this is indicative of being caught inside a range. This range is sideways and the initial levels to break and hold are either 124.46 or 123.36 and the initial levels to take out are either 130.22 or 127.60.
A hold above 130.22 ultimately has the ideal target of 141.32 or 144.12 and scaling points at 134.46, 136.19 and 139.68.
A hold below 127.60 has the initial key target at the red trendline then 123.36, a break down there has the ideal target at 113.70 and scaling points at 121.63, 118.85 and 115.01.
Trading involves substantial risk and is not suitable for all investors. Past performance is not indicative of future results.