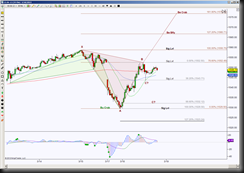
ES completed a Bullish Crab harmonic pattern at 1529.50, this is a reversal pattern that has retraced 78.6%, the great thing about the retracement scenario is price forms a new triangle which gives specific support and resistance levels.
- With the 78.6% retracement, this sets up for another emerging pattern, a Butterfly having a completion target at 1566.75
- Where price is in relation to the B point determines if the C point is complete at 1543.75 or has potential to go further down to 1532.25 or even 1529.50
- A hold above 1552.5 has target at 1566.75 with a scaling point at 1558.75
- Scaling points are potential rejection points, thus the importance of taking profit or protecting a position
- A hold below 1552.5 has 1543.75 as initial support test, a break down there has 1532.25 as important target with a scaling point at 1538.25
- If price breaks below 1529.50, it invalidates the emerging Butterfly
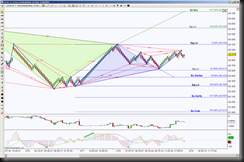
Whenever price is inside a range, there is high probability that there are opposing emerging patterns, what’s good about this is if gives a trader detachment of the outcome since there are targets in both directions.
- A break above 83.105 invalidates the blue emerging Bullish Gartley and gives probability of the green Bearish Butterfly of playing out
- So a hold above 83.105 has 83.737 as a target with scaling point at 83.420
- A hold below 83.105 has the Gartley PRZ (potential reversal zone) target at 82.476 with a scaling point at 82.611
- Understanding Harmonic patterns gives further downside targets if the Gartley fails to produce a healthy bounce retracement
- This particular scenario has a possibility of completing both patterns, providing the Bullish Gartley is complete and goes into retracement mode … having a key target at 83.737 which is the completion target of the Butterfly


