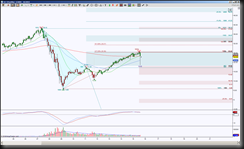
XLF, The financial sector ETF, monthly chart shows there’s an emerging harmonic pattern called a Bat. This particular pattern’s completion target is 34.47 however, there an intermediate factor in play whereas another pattern called ABCD, which is a measured move, was complete then attempted to retrace. This is harmonic pattern lingo for saying that while price was moving to the upside since 2009, there was a harmonic reason to test 25.35 as well as a rejection probability once price got there. So now XLF on a very large timeframe perspective is attempting to hold onto a bullish cross, giving bias to the upside, however that 25.35 to 25.62 region is a very important obstacle or resistance area, and failure to push and hold above there lessens that bias probability. The highest risk of shifting the bias to downside is if price can hold below 17.20.
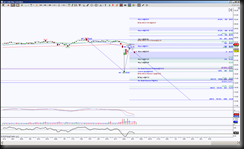
The Day chart view shows price has been in a retracement mode of a Bullish Shark harmonic pattern, again, lingo for a downside target of 19.1 was sought as well as a probable bounce point.. There are two ideal retracement targets for Sharks, one at the 50% mark for another harmonic pattern and the 100% mark. Currently price has exceeded the 50% mark at 22.07 and has had a respectable retracement. The Day chart is showing the pull to the downside and there are a couple of ways to look at this.
First, for the harmonic traders, price is seeking a required leg to the downside to enable an emerging pattern, the ideal minimum target is 21.23 and the max target is 18.52 for an emerging Butterfly to ensue, otherwise downside continuation targets are the ABCD levels noted in blue with emphasis at the larger Shark and ABCD convergence at 16.69.
Interpretation for non-harmonic traders is watch for a pull back attempt to 21.23, below there has ideal targets of 18.52 and 16.68 or even lower (yikes) to 14.76 or 12.30. A bounce off 21.23 or a hold above 22.91 has the ideal target of 24.81 but above there increases the probability of seeking the Month chart upside targets with scaling points at the blue colored levels.
Trading involves substantial risk and is not suitable for all investors. Past performance is not indicative of future results.


